
Research | DOI: https://doi.org/10.31579/2690-1919/193
School of Sport and Exercise, University of Gloucestershire, United Kingdom.
*Corresponding Author: Claire Mills, School of Sport and Exercise, University of Gloucestershire, United Kingdom.
Citation: Claire Mills (2021). Hydatid Cyst of the kidney and Ureter: A Review and Update of the Literature. J Clinical Research and Reports, 9(1); DOI:10.31579/2690-1919/193
Copyright: © 2021, Claire Mills. This is an open access article distributed under the Creative Commons Attribution License, which permits unrestricted use, distribution, and reproduction in any medium, provided the original work is properly cited.
Received: 02 August 2021 | Accepted: 06 September 2021 | Published: 17 September 2021
Keywords: body mass index; body image; 3d avatar; perception; female athletes; BMI; PBI
Introduction: The pressures of body image can be considered as demoralising, especially within the female sporting environment, where female athletes often express the greatest number of negative thoughts and feelings towards their own body shape, appearance, and dissatisfaction. Research surrounding body image, body composition and body mass index (BMI) has shown that when participants use visual impressions, for perceived body image (PBI) they have failed to produce realistic images and often lacked body stimuli with realistic weight manipulations (Madrigal, 2000). To portray more realistic statistically probable weight manipulations of a personalised stimuli, a 3D Avatar can be used to establish how female athletes perceive their body image. Therefore, the main objective of this investigation is to determine the correlation between actual and perceived BMI using a 3D Avatar within female athletes. Method:n =18 female participants between the ages of 18–23 years of age and competing in football and rugby at club and university level were recruited. Stretched stature (m) and body mass (kg) were taken and values used to calculate actual (kg/m²) and perceived BMI. A computer generated (Unity Player) 3D Avatar, with a visual slide from an underweight to average to obese continuum, was used to assess participants perceived BMI. P value was set at < 0.05 and a Paired Student t-Test was used to test for the difference. A Pearson’s Correlation Coefficient was then used to test the strength of the correlation between the actual and perceived BMI. Results: Actual BMI ranged from 19.5 - 36.9 (x̄ 25.1 ± 4.7), whereas the perceived BMI ranged from 23.2 - 30.8 (x̄ 26.7 ± 2.6). A Paired Student t–test set at P < 0.05 suggested a significant difference between actual and perceived BMI (P = 0.023), and a Pearson’s Correlation Coefficient test confirmed a strong correlation of r = 0.875. Conclusion: Results indicated that perceived BMI was higher than the participants actual BMI and suggested that female athletes competing in football and rugby have a large amount of body dissatisfaction.
Body image is based on an individual’s perception of one’s body, thoughts, and feelings about the way they look or feel in their body [9]. It is the picture of an individuals’ body that they form within themselves, the evaluation of your body’s size, weight, shape and muscularity and the thoughts and feelings that are associated with this [2,9]. Body image has therefore been regarded as an incredibly complex issue that can be influenced by parents, peers, society and the media as it has such an impact on the way we see ourselves and others [19,20,26].
Literature surrounding body image body composition and BMI has identified that two thirds of adults in the UK suffer from negative body image [20]. For instance, the prevalence of negative body image has been found to be higher among female athletes, where Nerini (2015) claimed that there is increasing pressure on a female athlete to be thinner [25]. Cash et al., (2004) perceive the pressures of body image as demoralising, especially within the female sporting environment, particularly when they are particularly prone to body image distortion and eating disorders. As such, female athletes face the highest risk of developing conditions such as anorexia due to sociocultural and sport-specific pressure to change their weight, body and appearance and feel more satisfied with the way they look [12]. Thus, there is a need for increased research and knowledge to understand further depth around body dissatisfaction levels.
One method of establishing a participant’s body perspective is to calculate Body Mass Index (BMI). By detecting a participant’s actual BMI, it allows the researcher to determine, using the BMI Healthy Weight Calculator, which category the participant is classified into (ranging from underweight to morbidly obese) [46]. Although other methods are viewed as more accurate, especially in athletes, BMI is universally viewed as an attractive objective measure that provides a range of benefits over other anthropometric methods, as it is inexpensive and quick [29,45].
Conversely, research suggests there is a significant under diagnosis for female athletes being overweight and underweight [6,38]. For instance, a study by Madrigal et al., (2000) incorporated both perceived body image (PBI) and measured BMI, reporting that there has been an underestimation of BMI through PBI, thus demonstrating that when participants use visual impressions, they often lead to a false sense of weight status. These early attempts for rating PBI using pictures and visual images have failed to produce realistic images and often lacked body stimuli with realistic weight manipulations [38]. To portray more realistic statistically probable weight manipulations of a personalised stimuli, a 3D Avatar can be used to establish how participants perceive their body image. A recent study carried out by Mills and Cooling (2020) used a computer generated (Unity Player) 3D Avatar, that rotated 360° and permitted a visual slide from an underweight to average to obese continuum. The principle behind most whole-body measurements, such as a 3D Avatar, has been to present participants with images of a body that has been expanded or contracted in horizontal dimensions, to stimulate changes in the adiposity [6]. Using a 3D Avatar will ensure that body size estimates are reflected subjectively through perceived body size without being influenced by the effects of unrealistic body shape deformations [41].
Actual and perceived BMI is a stimulating topic within society, individuals are constantly comparing their body image to the stereotypical athletes [10]. Research has already been conducted using a 3D Avatar, as Mills and Cooling (2020) found out that perceived BMI was higher than the actual BMI, when using a general population of females. However, female athletes participating in leanness-promoting sports, experience greater body dissatisfaction than women in other sports or non-athletes [41]. Therefore, this study will establish the correlation between actual (calculated BMI) and perceived BMI (via the medium of a 3D Avatar) with female athletes who are currently competing in football and rugby.
Participants and recruitment
n = 18 female volunteer participants, aged 18-23 years old, that are currently playing competitive football and rugby at university or club level, were recruited for this study. Selective and purposeful sampling took place via email and social media recruitment processes. Ethical clearance was approved by The University of Gloucestershire Research Ethics Committee. All participants were aware of their right to withdraw and gave their informed consent.
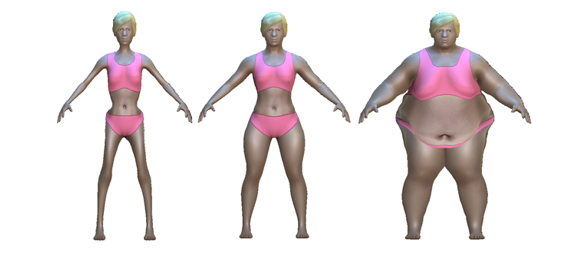
The questionnaire that was used was not pre-validated and was designed in line with literature relating to body image and body dissatisfaction amongst females [22]. A pilot study was conducted prior to data collection to reduce the risk of participants’ confusion and to ensure their understanding of the given questions. In doing so, it reduced any risk of typing/wording errors, respondent confusion and bias [1]. The questionnaire consisted of closed questions and was presented in 3 parts (A: personal details; B: Calculated BMI and C: Perceived Body Image). Whilst the preferred approach to this study would have been to use a 3D image of a woman that is able to rotate 360° and can visually slide from underweight to average to obese continuum, this was unable to take place due to COVID-19 pandemic. The software for the computer generated avatar was unable to be accessed, therefore, alternative 2D screen shots were taken illustrating 10 different images (ranging from anterior, lateral, and posterior and from underweight to average to obese continuum) (see Figure 1). Participants were asked to identify one of the images which best represented their body, thus their perceived BMI.
All data from the questionnaire and proforma was transferred to a Microsoft Excel spreadsheet, to allow for statistical analysis. Firstly, BMI was calculated from the self-reported body mass (kg) and stretched stature (m) measured by using the formula (BMI = kg/m2) (National Health Service, 2019). Secondly, data from the perceived BMI (obtained from the 3D Avatar images) were collated and compared against the BMI continuum. A Paired Student t-test (t) was used to establish the association between the actual and perceived BMI and was set at P < 0>
Questionnaire Part A: Personal Information
22.2% of participants were aged 18-19, whilst the remaining 77.8% were aged 20-22 with an average age of 20.5 years. Whilst there have been previous studies conducted using solely females, few have focused on younger female adults. For example, some studies either focused on females below the age of 16 or females over 25 years [32,44]. With limited studies that focused on young females, it was therefore important to recruit young female participants for this study as Šerifović-Šivert and Sinanović (2008) found that age was a significant factor, and ANCOVA tests showed statistically significant effects for the category of age (P = 0.003). Taking a covariant in consideration, young women showed significantly more body dissatisfaction (0.65 ± 0.7) than mature women (0.21 ± 0.10).
100% of participants answered White British and whilst this response was not going to impact whether participants were used for this study, it was still viewed as an important response. A study conducted by Mikolajczyk et al., (2012) found that comparisons across ethnic groups were significant (P < 0.05). African-American students’ perceived appearance was significantly more positive, and they were less likely to perceive themselves overweight at higher BMI scores, compared to other ethnic groups, thus suggesting that different ethnic groups perceive their BMI differently. 66.6% of participants were at the time playing football for the University of Gloucestershire and 16.7% were at the time playing rugby for the University of Gloucestershire and the remaining 16.7% were at the time playing football for Swindon Town Women’s football team. As athletes are particularly prone to eating disorders, Stice and Shaw (2002) indicated in their study that, heightened dissatisfaction with the body increases the risk of various adverse outcomes, including body image distortion and eating disorders. According to Stice and Shaw (2002) body dissatisfaction within certain sports such as football and rugby may be viewed as a primary precursor of eating disorders, for instance, abnormal eating, which can include restrictive eating, overeating, skipping meals, and binge-eating and the use of diet pills and diuretics are undertaken by athletes to achieve desired weight or body shape. Suggesting that athletes are experiencing the largest amount of body dissatisfaction and are therefore at the greatest risk of developing eating disorders [16]. Kantanista et al., (2018) conducted an alike study within sport but this was within aesthetic sports (dance and synchronised swimming), their findings declared a more positive body image (P < 0>et al., (2018) who used aesthetic sports.
Questionnaire Part B: Calculated BMI
Participants actual BMI ranged from 19.5 - 36.9 (± 4.7). Results indicated that 66% of participants were classified as healthy, 22.2% were classified as overweight and 11.8% were classified as obese. These figures are in comparison to a study conducted by Mills and Cooling 2020 who found a BMI range from 17.7 - 31.3, when using a general population of females. Thus, showing that when working with female athletes, the BMI range was 5.6 higher than non-female athletes. Comparing the actual BMI results with Mills and Cooling (2020) results would suggest that athletes are a lot more likely to be classified as obese and overweight, suggesting they are unhealthy. Whilst BMI is still viewed as the best available tool, Hall and Cole (2006) state that this is for public health purposes and is not an appropriate indicator for assessing weight in athletes which require physical strength as it has the ability to overestimate their level of body fat as muscle is denser than fat [7,13]. A study shown by Prentice and Jebb (2001) has shown that the accuracy to classify an athlete as overweight may be incorrect due to differences in body composition, such as fat and muscle mass. Due to COVID-19 restrictions and health and safety of the participants, it meant that in this study participants were self-reporting their weight and height in order for the researcher to calculate their BMI. Fattah et al., (2009) found that if self-reporting is used for BMI classification it can lead to incorrect results, as they found that 22% of women were classified incorrectly when BMI was measured by the researcher. 12% of the women who were classified as having a normal self-reported BMI were overweight and 5% classified as overweight were obese. This may be another reason as to why there was a difference between this study which used self-reported height and weight and Mills and Cooling (2020) where the researcher was present for these measurements.
Questionnaire Part C: Perceived BMI
Participants perceived BMI ranged from 23.4 - 30.8 ± 2.6 and 55.5% of participants were classified as overweight, 27.7% were healthy and 16.8% were classified as obese. Mölbert et al., (2018) investigated perceived BMI by creating realistic virtual 3D Avatars for each participant. Their results found that women with Anorexia Nervosa underestimated their perceived BMI, differing to other research, as when using a generalized Avatar, it showed that women with Anorexia Nervosa overestimate their perceived BMI. Thus, implying that if this study were to create a situation equivalent to looking in the mirror for participants, results for perceived BMI may differ. Whilst using a 3D Avatar is viewed as the most reliable method to apply for perceived BMI as Thaler et al., (2018) states that using an Avatar will ensure that body size estimates are reflected subjectively through perceived body size, without being influenced by the effects of unrealistic body shape deformations. However, Cornelissen et al., (2017) suggest that when applying this method, we must assume there is likely to be an additional cognitive load and uncontrolled source of variability, in asking participants to state their own body shape and size against another individual.
Studies from Clazo et al., (2015) and Ricciardelli and Yager (2015) have shown that women with a higher actual BMI are more likely to report higher levels of unhappiness, for example 100% of women who were classified as overweight, perceived themselves as obese and having particularly negative body attitude towards their visual appearance. The average perceived BMI was 0.8 higher than participants actual BMI, thus suggesting that this study should have a higher average perceived BMI than the study carried out by Mills and Cooling (2020). Another reason as to why athletes in this study perceived themselves higher compared to a general population of females that were used in the study carried out by Mills and Cooling (2020) would be due to the sport-specific pressures. Kong and Harris (2015) found that female athletes that participate in sport, reported higher levels of body dissatisfaction than those who do not participate in sport. Thus, supporting the argument from Martin et al., (2000) that when females are involved in a physical sport it will greatly influence how these women interpret their physical presentation of their bodies.
Comparison of actual vs perceived BMI
Table 1.0 illustrates the general summary characteristics for participants actual BMI and perceived BMI. Results indicated that actual BMI ranged from 19.5 - 36.9 with an average of 25.1 (± 4.7), whereas the perceived BMI ranged from 23.2 – 30.8 with an average of 26.7 (± 2.6).
| Variables | x̄ ± x | Range | diff |
| Actual Body Mass Index | 25.1 ± 4.7 | 19.5 – 36.9 | 4.7 |
| Perceived Body Mass Index | 26.7 ± 2.6 | 23.2 – 30.8 | 2.6 |
Table 1: General summary (x̄ ± s) characteristics for n = 18 participants
Raw data was transferred into a Microsoft Excel spreadsheet and a scatter plot generated (See Figure 2), to establish whether there was visual correlation between perceived BMI and actual BMI with P value 0.023, t =0.063, R² = 0.7653 and r = 0.875 suggesting a significant difference between actual and perceived BMI (P < 0>

Whilst it is far from ideal to compare the results of this study to just one solitary study, the study conducted by Mills and Cooling (2020) has a strong association in study design as they both used a virtual body shape Avatar (figure1). In addition, there is little academic research within this area where comparisons can be made to the same effect. The R² value (0.7653) of this study is considered strong as it is greater than 0.75, this is in comparison to Mills and Cooling (2020) who also found a positive correlation between the two variables. However, their R² value was not considered strong (R²=0.628). Thus, suggesting that there is a stronger correlation in female athletes compared to a general population of females. Additionally, findings from Mills and Cooling (2020) are similar to this current study, who found a value of t = 0.81 and r = 0.68, suggested a significant difference between actual and perceived BMI (P < 0>et al., (2015) who stated that female athletes were more likely to be dissatisfied with their bodies compared to non-athletes. Conversely, results from the current study and the finding from Mills and Cooling (2020) contradict findings from Molbert et al., (2018) who found that participants were underestimating their BMI and found that women with Anorexia Nervosa and controls, underestimated their BMI, with a trend that women with Anorexia Nervosa underestimated more. The difference in results could be attributed to the populations used within the studies. The study conducted by Molbert et al., (2018) used a population of women with Anorexia Nervosa compared to the current study that used female athletes. Further to this Molbert et al., (2018) also created realistic virtual 3D bodies (Avatars) compared to this study which used the same standard 3D body Avatar for all participants. Whilst the statistical shape model used in Molbert et al., (2018) is one of the most realistic to date, it was built to represent the shape of a normal weight population and may not perfectly characterise variations in weight at the extreme end of the spectrum. In comparison to the study carried out by Molbert et al., (2018), a study conducted by Mueller et al., (2015) also found participants underestimated their BMI, as the average perceived BMI was significantly lower than the average actual BMI (27.6 ± 5.7 kg/m² versus 28.3 ± 6.1 kg/m²; P < 0>
The average age of participants in the study carried out by Mueller et al., (2015) was 63 years, with 70% of participants identified as overweight and obese, compared to this study where the average age was 20.5 and only 22.2% were classified as overweight. Furthermore, the above studies, that found participants to underestimate their perceived BMI, included no female participants engaging in football or rugby, which is viewed as the population with greatest amount of body dissatisfaction. This may be due to them experiencing pressures that other populations in other studies may not have experienced, for example a coach making negative weight-related comments. Kong and Harris (2015) reported that more than 60% of elite female athletes reported pressure from coaches that they believed had led to them feeling dissatisfaction towards their body image. Whilst Reel et al., (2013) states that parents, friends, media, competitiveness, and training regime may all also add pressure on female athletes and promote body dissatisfaction. Evidence from Reel et al., (2013) research indicated that female athletes are experiencing the greatest amount of body dissatisfaction, as this study shows they are the population that are overestimating their perceived BMI the greatest in comparison to other subpopulation groups. It is vital this is taken into account when working with female athletes as Stice and Shaw (2002) indicated within their study that, in turn, heightened dissatisfaction with the body increases the risk of various adverse outcomes, for example eating disorders. Findings from this current study and the study conducted by Mills and Cooling (2020) agree with research by Caccamese et al., (2002) who also discovered that the use of visual impressions often led to a false sense of weight status. These results suggest that perceived BMI was higher than the participants actual BMI, however, further research is necessary to investigate the reasons behind these perceived versus actual differences.
Body image is complex and can be easily influenced, it is one of the most talked about areas within society as it has such an impact on the way we see ourselves and others [9]. Due to the pressures involved within the female sporting environment, it has been suggested by Nerini (2015) and Murnen and Don (2012) that the prevalence of body image is higher among female athletes. Although body image perception is challenging to assess, given its subjective nature and variety of manifestation, the most common body perception assessments have placed heavy reliance on methods such as photographs or 2D drawings of a silhouetted figure, for example Stunkard figure rating scale (Ralph-Nearman et al., 2019). However, this commonly employed method has failed to produce realistic images [38]. Computer-based tools have been previously created as an alternative to visually based assessments and more recently, have utilised 3D Avatars that can be manipulated by individuals (see figure 1). According to Cornelissen (2017), Thaler et al., (2018) and Son et al., (2012) using a 3D Avatar is considered as one of the most reliable ways to understand participants perceived BMI, as it will allow the researcher a method that portrays realistic statistically probable weight manipulations of a personalised stimuli.
The main findings of this study indicated that 66% of participants were classified as healthy, 22.2% were classified as overweight and 11.8% were classified as obese. These findings suggest that athletes are a lot more likely to be classified as obese and overweight as the average actual BMI ranged from 19.5 - 36.9 with an average of 25.1 (± 4.7), compared to Mills and Cooling (2020) who used a general population of females with a similar study design and found that actual BMI ranged from 17.7 – 31.3 with an average of 24.3 (± 3.7). Participants perceived BMI differed to their actual BMI via the 3D Avatar, with a range of range of 23.2 - 30.8 with an average of 26.7 (±2.6), where 55.5% of participants were classified as overweight, 27.7% were healthy and 16.8% were classified as obese. Further analysis found that there was a positive correlation r = 0.875 between actual and perceived BMI. Actual BMI ranged from 19.5 - 36.9 (x̄ 25.1 ± 4.7), whereas the perceived BMI ranged from 23.4 - 30.8 (x̄ 26.7 ±2.6). It is evident from the findings that the average perceived BMI was higher than the participants actual BMI, suggesting a significant difference between actual and perceived BMI (P = 0.023) and that the use of visual impressions led to a false sense of weight status. These findings support Kong and Harris (2015) and Martin and Govender (2011) who found females that participate in sport, reported higher levels of body dissatisfaction, than those females who do not participate in sport. As this current study had an average perceived BMI 3.2 higher than Mills and Cooling (2020), who used a general population of females. Whereas results from this current study contradicts findings from Madrigal et al., (2000) who used nine silhouette drawings to assess perceived BMI, as it found there was often an underestimation of perceived BMI within females. Whereas this current study agreed with research conducted by Cornelisson et al., (2017) and Caccamese et al., (2002) who also discovered that using visual impressions often led to a false sense of weight status. Suggesting that the statement by Cornelissen et al., (2017), Thaler et al., (2018) and Son et al., (2012) is as reliable as using a 3D Avatar ensures that body size estimates are reflected subjectively through perceived body size without being influenced by the effects of unrealistic body shape deformations. More recent research has investigated the correlation between actual and perceived BMI using a 3D Avatar [22]. However, there has been little research using a population of female athletes competing in football and rugby.
In summary, results from the current study support the statement by Kantanista et al., (2018) who declared that athletes are a subpopulation that often overestimate their perceived BMI compared to their actual BMI. As body dissatisfaction is defined as a discrepancy between the actual and ideal body weight and shape, it therefore implies that this current study indicates that female athletes competing in football and rugby have a large amount of body dissatisfaction due to the environmental pressures that sport can bring shape [31].
Dear Editorial Team, Clinical Medical Reviews and Reports. My experience with the journal was highly positive. The peer-review process was rigorous, constructive, and completed in a timely manner. The reviewers provided valuable comments that helped improve the quality and clarity of our manuscript. The editorial office was professional, responsive, and supportive throughout all stages of the publication process. Communication was clear and efficient, and any questions were addressed promptly. Overall, I found the journal to maintain high scientific standards and an excellent publication workflow. I would be pleased to consider submitting future work to this journal. Best wishes from, Elena Popa.

It was my pleasure to submit my testimonial concerning the Reviewer Board of our Scientific Journal “Brain and Neurological Disorders”. The Reviewers focused on some modifications and their contribution was helpful. The ladies of our Editorial Office were also supported my efforts. It was my honor to have such a co-operation and I am looking forward for more collaboration.

Dear Grace Pierce, Editorial Coordinator of Journal of Clinical Research and Reports, Thank you for the speedy and efficient peer review process. I appreciate the fact that your peer reviewers do not take months to respond like with some other journals. I would also like to thank the editorial office for responding quickly to my questions. It is an excellent journal. I plan to submit more manuscripts in the future. Best wishes from, Robert W. McGee

Dear Grace Pierce, Editorial Coordinator of Journal of Clinical Research and Reports, Working with you and your team on our recent publication in JCRR has been a truly wonderful and enjoyable experience. The responses were prompt, and the reviewers were patient, constructive, and highly professional. One reviewer in particular gave me the feeling that a professor was carefully reading and commenting on my coursework, which was deeply touching. The entire process was straightforward and hassle‑free, with no tedious online forms to complete. I highly recommend this journal. Best wishes from, DR Aibing Rao, Head of R&D

I Appreciate the Opportunity to Share my Experience with the Journal of Clinical Research and Reports. The peer review process was timely and constructive, and the feedback provided helped improve the quality of our manuscript. The editorial office was professional, responsive, and supportive throughout the process, ensuring smooth communication and efficient handling of the submission. Overall, it was a positive experience collaborating with your team.

Dear Mercy Grace, Editorial Coordinator of Obstetrics Gynecology and Reproductive Sciences, We would like to express our gratitude for your help at all stages of publishing and editing the article. The editors of the magazine answer all the necessary questions and help at every stage. We will definitely continue to cooperate and publish other works in the Obstetrics Gynecology and Reproductive Sciences! Best wishes from, Alla Konstantinovna Politova,
