AUCTORES
Globalize your Research

Research Article | DOI: https://doi.org/10.31579/JHV-2021/019
*Corresponding Author: S.M. Debbal. Genie Biomedical Laboratory (GBM), Faculty of Technology, University Aboubekr Belkaid Tlemcen BP 119, Algeria
Citation: Fandi T. eddine, S. M. Debbal, L. Hamza Cherif, F. Meziani (2021) Cardiac’s Sounds Signals Analysis. J, Heart and Vasculature. 1(4); DOI: 10.31579/JHV-2021/019
Copyright: © 2021, S. M. Debbal, This is an open access article distributed under the Creative Commons Attribution License, which permits unrestricted use, distribution, and reproduction in any medium, provided the original work is properly cited
Received: 21 May 2021 | Accepted: 03 June 2021 | Published: 17 June 2021
Keywords: phonocardiogram, heart sounds; heart murmurs; wavelet denoising; shannon energy; segmentation; algorithm; parameters, measurements and statistics
The presence of abnormal sounds in one cardiac cycle, provide valuable information on various diseases. Early detection of various diseases is necessary; it is done by a simple technique known as: phonocardiography. The phonocardiography, based on registration of vibrations or oscillations of different frequencies, audible or not, that correspond to normal and abnormal heart sounds. It provides the clinician with a complementary tool to record the heart sounds heard during auscultation. The advancement of intracardiac phonocardiography, combined with signal processing techniques, has strongly renewed researchers’ interest in studying heart sounds and murmurs.
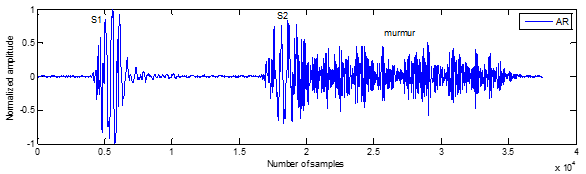
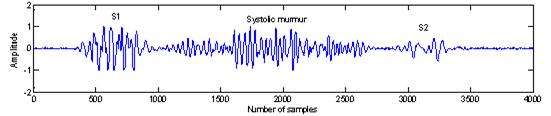
This paper presents an algorithm based on the denoising by wavelet transform (DWT) and the Shannon energy of the PCG signal, for the detection of heart sounds (the first and second sounds, S1 and S2) and heart murmurs. This algorithm makes it possible to isolate individual sounds (S1 or S2) and murmurs to give an assessment of their average duration.
Noninvasive diagnosis, such as phonocardiogram (PCG), offers useful information of functioning heart. The heart produces four sounds for each cardiac cycle. However, most often only two sounds appear essential: S1: corresponding to the beginning of ventricular systole is due to the closure of atrioventricular valves [1].
This sound is composed of two internal components: the mitral component (M1) associated with the closure of the mitral valve, and the tricuspid component (T1) associated with the closing of the tricuspid valve [1]and S2: marking the end of ventricular systole and signifying the beginning of diastole, is made up of two main components: the aortic component (A2) corresponding to the closure of the aortic valve, and the pulmonary component (P2), corresponding to the closure of the pulmonary valve [2]. Two other sounds: S3 and S4, with lower amplitude than S1 or S2 [3], appear occasionally in the cardiac cycle by the effect of disease or age.
In auscultation, the listener tries to analyze the heart sound components separately and then synthesize the heard features. Heart sound analysis by auscultation highly depends on the skills and experience of the listener [4].
Therefore the recording of heart sounds and analyzing them by a computerized and objective way would be most desirable. Several techniques had been used to analysis the PCG signal components. Before any analysis, the PCG signal needs to be segmented into components (sounds or murmurs), and then the components are analyzed separately. The oldest ones are based on the Fourier Transform (FT), which produces an average spectrum over time. This is can be suitable for signals whose statistical properties are invariant over time "stationary" [4].
The physiological signals spectral content; such as the PCG cases; evolves with time. Consequently, the techniques of temporal averaging amplitudes are incapable to describe transients and no stationary events [5]. As a result, time-frequency approaches have been proposed. Indeed, the Short-term Fourier transform (STFT) is one of the oldest methods that are used to analysis biomedical signal. Unfortunately, it may not allow good resolution in time and frequency simultaneously [6]. Other techniques such as wavelet transform are proposed. In the next section, a detailed description of this technique will be done.
Several statistical parameters are deduced from this technique which can give more in the understanding of cardiac activity and at the same provide a valuable aid to clinicians
In this paper the denoising by wavelet transform (DWT) will be used in the analysis of various signals PCG. Several statistical parameters are deduced from the results of applying the wavelet transform which can give more in the understanding of cardiac activity and at the same provide a valuable aid to clinicians [7].
The wavelet transform is based on the use of special function called mother transform. This special function will be undergoing to a translation and contraction or dilatation operations to give a set of functions called wavelets. These functions are a constant shape but variable size. When the studied signal is analyzed by wavelets, a set of coefficients are obtained. Those coefficients represent the correlation between the wavelet and the studied signal. They are given by equation 1.

Where, a represents the scale and b the translation coefficient. The wavelet transform (WT), applies a multi-resolution analysis on the signal studied. This analysis might be called time-scale, uses a wide range of scales to analyze the signal. When the a and b factor are continuous, the wavelet transform is a continuous wavelet transform (CWT) (equation 2).
The CWT is used when no reconstruction of the original signal from the obtained coefficients is needed. By contrary, when the original signal is needed to be reconstructed, a discretization of the a and b factors must be done. The obtained wavelet is named the discrete wavelet transform (DWT). The discretization can be done by equation 3

In fact, the wavelet transform is also interpreted as a process of filtering the signal analyzed by a pair of low and high pass filters with variable bandwidth.
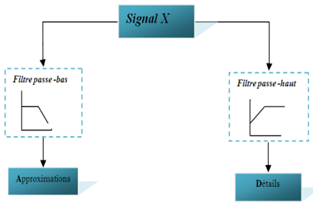
Details (D) represent the high frequency events whereas the approximations (A) are slow events.
Our aim with thisdenoisingis to extractthe heart sounds (S1 and S2) of murmursthat are consideredin this stage as the noise.
The modelconsidered for thedenoisingis classic, the measured signal x is an additive mixture of signal informations and a measurement noise r:
Langue source : français
x(t) = s(t) + r(t) (4)
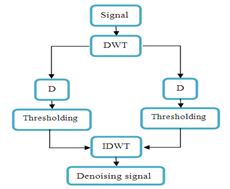
Denoising by thresholding the wavelet coefficients, as defined in [8], is to extract a coherentstructure of the measured signal. The assumption that the noiser considers as not consistent with a database of predefined waveform, that is to say notcorrelatedwith thesewaveforms.The coefficients ofthe decompositionof noise onthe base is low, this gives the possibility to remove them easily.
The most commonly used algorithm is the decomposition of a discrete wavelet orthonormal basis of Mallat [7]:simple decomposition and reconstruction exact, the value of a projectionon an orthonormal basis is the factthatpermits conservation of energy from one representation to another.After thedecomposition of the signal on this basis, thesegmentsless correlatedwith the baseof the coefficientsarelow, andthey are attributedto noise.Asuitablethreshold, we can separate the noise (incoherent part), signal (coherent part).
The denoised signal is generated through an inverse construction (IDWT). This procedure is shown in Figure2.Vos [9], Messer and al. [10] used this approach in the phonocardiogram signal denoising.
In the literature, there are two types of thresholding: hard thresholding and the soft thresholding. [11]
The first proposes the can collation of all values below athreshold T, the higher values are unchanged.
(Wjk: Coefficients of the decomposition of the signal x). [6]

The second method operates in addition to the cancellation, a subtraction of the threshold valuesremaining above the threshold, to reduce the number of discontinuities in the denoised signal. [6]

The threshold T can be calculated in different ways. The method chosen in our algorithm was developed by Donoho and Johnstone [12], known by the universal thresholding.
Before applying a wavelet denoising, we must consider some parameters, such as the type of wavelet used, the decomposition level selected and the type of thresholding. Messer and al [10] proved that the universals thresholding give very satisfactory results.
The wavelet transform (WT) remains most appropriate for analysis of heart sounds (normal and pathological).This technique has shown its effectiveness in time-frequency analysis, which is due to its analysis window size adaptive and flexible allowing it to have a good time resolute on for high frequency components and good frequency resolution for low-frequency components [6], [13-14].
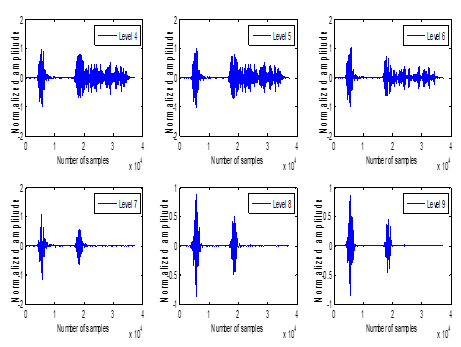
The analysis of PCG signals using wavelet transforms has shown that it is important to find out the appropriate wavelet. The study carried out on different types of orthogonal and bio-orthogonal wavelet at different levels using the standard deviation, and the error of rebuilding as a discrimination parameter has shown that the Daubechies wavelet of the seventh level :db7 can be used in PCG signal analysis. In fact its morphology and duration are highly correlated to the different sounds in the PCG [15-18].
Messer and al. [8], found that the 10th level of decomposition is the best for denoising PCG signals sampled by 44:1 kHz, where they used the Daubechies wavelet of the seventh level: db7.Moreover, they proved that the universal soft thresholding gives very satisfactory results.
The sampling frequency of the PCG signal has a great influence on the appropriate decomposition level for denoising.
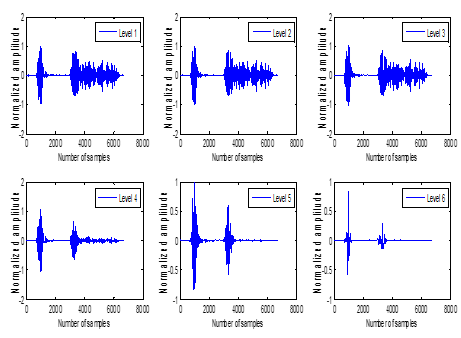
To show the influence of sampling frequency on the optimal decomposition level. The following figure (Figure.3-5) presents a PCG signal generated on two different sampling frequencies.
In the first case (Figure.4), the optimal denoising is successful in the fifth level, beyond this level the signal begins to distort. For the second case (Figure.5), the ideal denoising appears from the seventh level; however, few traces remain of murmurs.
Indeed the decrease in signal distortion relative to the increase in sampling rate can be explained as follows:
Actually increasethe sampling rate is an improvement in signal resolution: the number of samples will be higher andthe sound quality will be better.
In first case: fs = 8000 Hz, the signal converges rapidly to the deformation; however the limited number of samples makes the perfect denoising operation. With a sampling frequency of 44.1 kHz, the number of samples is quite sufficient for the resolution is still good; therefore, the signals are reconstructed slightly deformed. However, the high number of samples makes the process of denoising worse. In our work, and in order to have a good filtering, we chose8000 Hz as the sampling frequency for all PCGsignals that will be addressed. Changing the sampling frequency is performed by software sound processing (WAVEdit).
The proposed approachto separate the components of thePCG signal, also based on the detection the envelope of the temporal energy of the heart sounds. Indeed the temporal lobes of the energy of the PCG signal are correlated with intracardiacevents. Energy Shannoncan better represent the oscillations of small amplitude, not just large amplitude oscillation. [19]
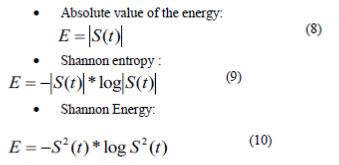
In the literature, various approaches can be found to extract the envelope E (t). One such approach is an analytical method based on Hilbert transform. However, there are other methods to extract the envelope as the calculation of the square of the signal or absolute the Value [Eq. (7)-(8)].
The square of the samples of a given signal [Eq. (7)] makes it possible to evaluate its energy in the temporal field. However, and as illustrated in Figure.6, samples of high amplitude are very heavily favored over those of low amplitude. The amplitude of the energy calculated by the absolute value [Eq. (8)] of the samples of the signal also disadvantages samples of low amplitude. Two other approaches can be used, are the Shannon entropy and Shannon energy, see equation [Eq. (9)-(10)]. These approaches give greater weight to the average intensities of the signal, therefore, the noise of low intensity and high intensity of disturbance will be mitigated. Similarly, the Shannon entropy [Eq. (9)] does not yield the true proportions of the signal, attenuating more samples of very low amplitude for the benefit of large-amplitude oscillations. The Shannon energy [Eq. (10)] proves the median approach, making it possible to generate a representation that takes account of the physiological attenuation of heart sounds as well as artifacts of large amplitude while recording the PCG signal. [11]

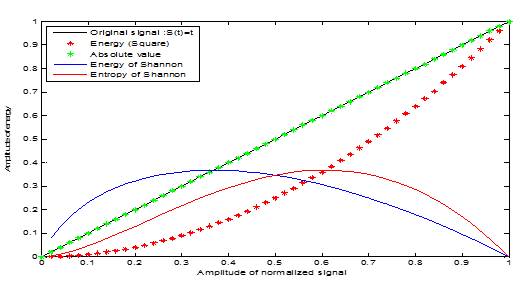
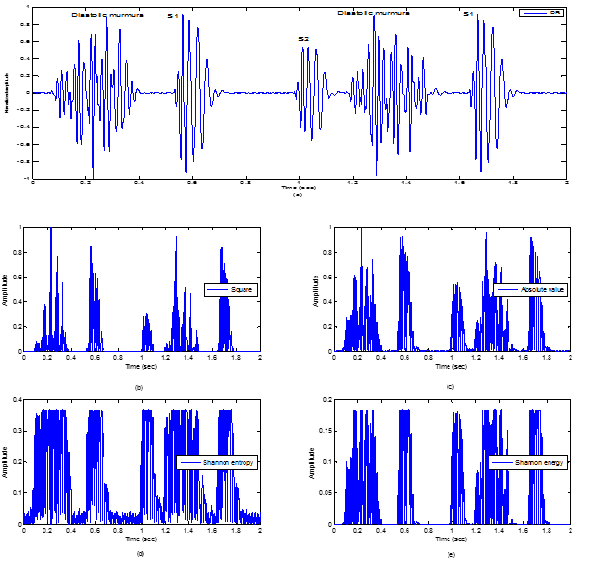
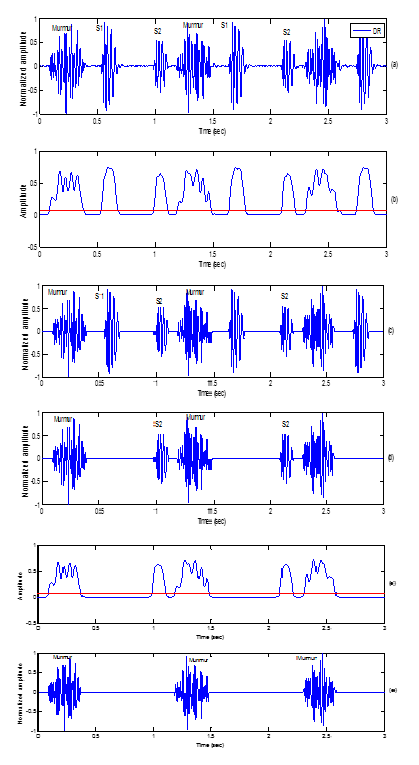
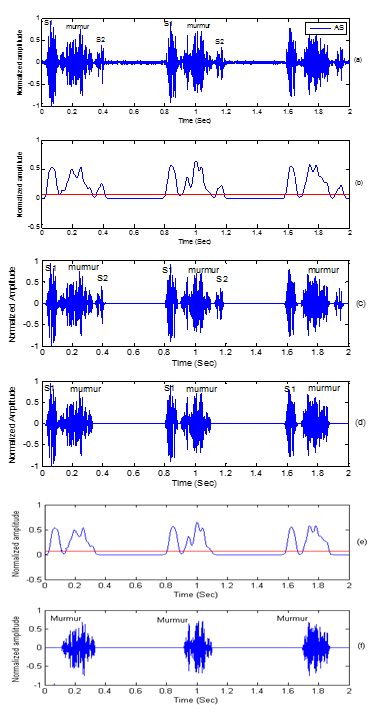
The PCG signal energy representations [Figures. 7(b, c, d and e)] highlight the interest of the Shannon energy. According to these figures, we can see that only the Shannon entropy and the Shannon energy can absorb the magnitude of oscillations of high intensity as well as those in low amplitudes. The shape of the curve of the Shannon energy promotes weak oscillations, which will give energy representations that take into account the unit of the heart sounds and heart murmurs.
Indeed, as illustrated in Figures. 7 (b, c, d and e), we can see the value of the Shannon energy [11] [Figure. 7(e)] compared to the other methods used. The Shannon energy places more emphasis on oscillations of low amplitude while also representing those of high amplitude. Thus, the Shannon energy is used in PCG segmentation.
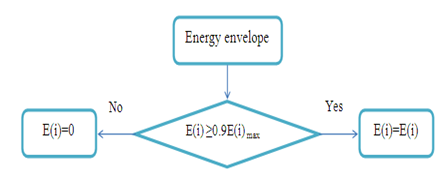
The algorithm of separation depends primarily on the detection of the envelope of Shannon energy for the identification of the beginnings and ends of the cardiac sounds S1 and S2. This envelope detection extracted
by applying a low-pass filter, with a cut-off frequency f0 of 20Hz chosen empirically. This filtering is reinforced by an algorithm to remove low energies below 90% of max.
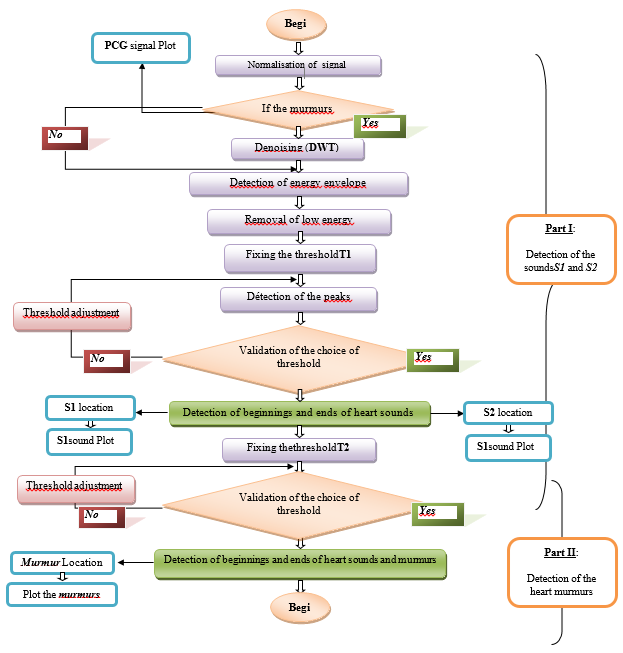
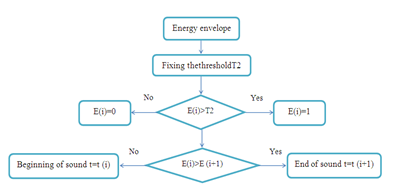
The aim of this section is to develop an algorithm for heart sound and heart murmur location and separation, and to measure the various time and frequency parameters. The proposed PCG segmentation algorithm is shown in Figure9.
Valvular heart diseases induce considerable changes on the morphology of the phonocardiogram signal. These changes can be seen as a change in duration, amplitude or the frequency content of sound S1 and S2 or systolic and diastolic murmurs. These parameters must be calculated in a precise manner to allowa proper assessment of severity. Therefore, the segmentation of the PCG signal appears important to facilitate this task.
The proposed algorithm is based on envelope detection PCG signal. This latter may give us much information about the signal, how it can help us separate the sound S1 and S2 and the different murmurs. For this, several approaches can be used, among them the energy envelope detection.
Several algorithms based on envelope energy detection have been proposed [20-22].These approaches are effective in cases where the power of sound S1 and S2 is much higher than the murmurs, but they quickly find their limit when the power of murmur is almost the same or higher than the sound.
Therefore, applying the discrete wavelet decomposition in our algorithm is very important to solve this problem. In fact, as the frequency content of murmurs is more important than those sounds, DWT can be separated easily by technique of the denoising by thresholding (wavelet denoising).
This algorithm (Figure 6) has six main parts:
All these parameters will be considered to analyze the PCG signals.
Due to the complexity of the phonocardiogram signal, our algorithm (Figure.9) consists of a supervised manner: the user must adjust some parameters to achieve optimal segmentation (threshold, decomposition level …).The choice of threshold is very important in order to have interesting results. The duration of the heart sounds or heart murmurs may change if the choice of threshold is not taken into account (see Figure. 13).
The choice of threshold is also important for detection of the heart murmurs. Thus, for each heart murmur or click, one chooses a precise threshold. After normalization of the PCG signal the user has the choice to perform discrete wavelet decomposition (DWT). This passage is necessary if the murmurs present a high intensity (Figure.10). The frequency content of murmurs is more important than those sounds, for that, the DWT can be used as a filtering means relatively simple and very effective to remove high frequency components.
The sampling frequency of PCG signals is given by the following table. Since the optimal denoising appeared in the fifth level of decomposition, there constructed signal in this level is used in the detection and identification of different sounds. The Shannon energy envelope is used in this detection.
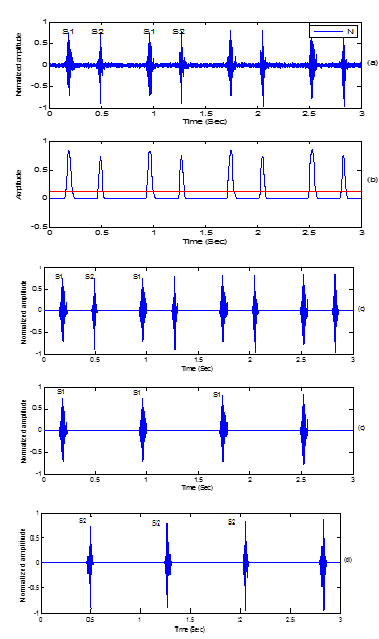
The algorithm of segmentation was applied here for the separation of the heart sounds S1 and S2 of various PCG signals (using the first part of the proposed algorithm).This identification of heart sounds is based essentially on detection of different peaks of the envelope. This is done by applying a threshold set manually.
It is known beforehand that the duration of systole is shorter than that of the diastole. Based on this reality, the identification of sound S1 and S2 can be performed.
The detection of the first and the second heart sound (S1, S2) can be done using the following conditions:
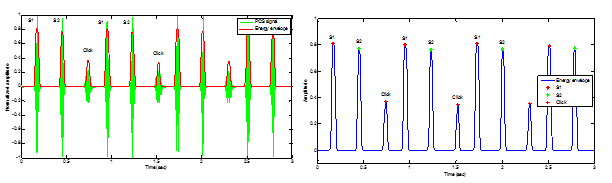
In fact, in this step the energy envelope of Shannon (figure: 11. (a)) can be a very effective parameter not only in identifying sounds S1 and S2 peaks (figure: 11. (b)), but also in the detection of the beginning and end of the each heart sound.

This detection procedure is performed by the following three parts (Figure: 12):
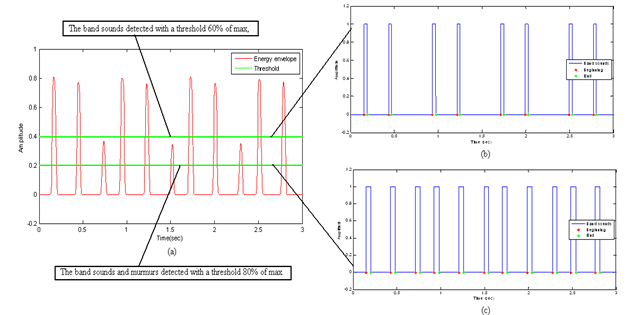
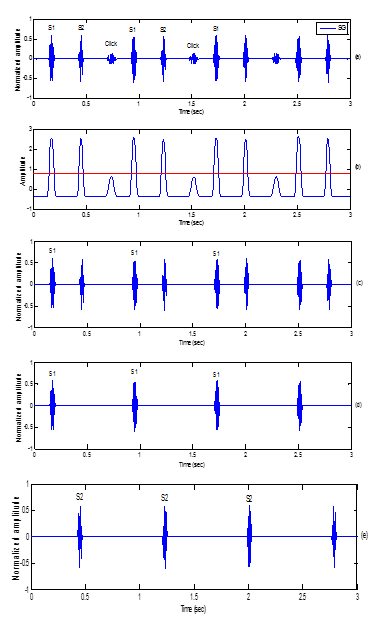
After the detection and identification of different heart sounds clicks and murmurs analysis becomes easier. It requires detection of the side minima of each peak of the energy envelope. For that, a threshold value is chosen. The murmurs and click separation is done with a same procedure applied to separate the first and the second heart sound.
After applying our algorithm on different PCG signals, the results are very satisfactory. This shows the power of the approaches used in the detection of sound S1 and S2and extraction of murmurs. However, this algorithm is limited by the very complex cases, where the sounds are completely immersed in the murmurs.
Figure.18(a ,b), illustrates two examples of this type of difficulty encountered: if one does not have a location of the beginning and end moments of heart clicks, and even if we change the threshold of the energy envelope, we will not have satisfactory results.
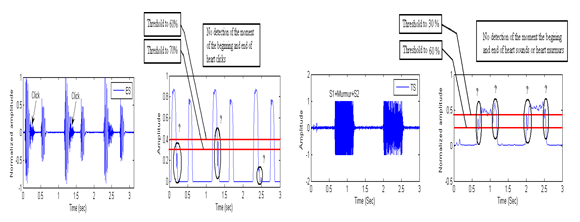
For facing this problem, we will use thecontinuous wavelet transform (CWT) to provide a graphical extraction of murmur. The latter has proven to be the best approach may well represent the time and frequency components of a signal.
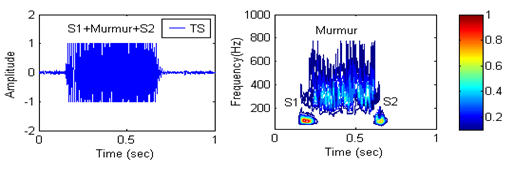
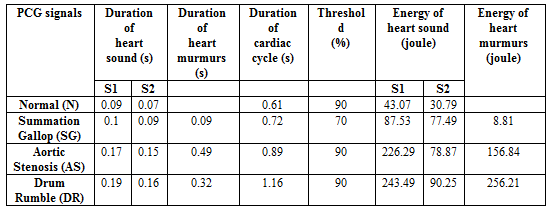
Table 1 gives the results of this segmentation of four PCG signals, Normal (N), Summation Gallop (SG) Drum Rumble (DR) and Aortic Stenosis (AS). Based on these results, it may be observed that the duration of the first heart sound S1 is longer than the duration of the second heart sound S2; the algorithm of separation thus gives satisfactory results. The systole phase is of shorter duration compared to the diastole phase. Thus we find that the cardiac cycle length and the energy, varies with the presence and type of heart murmur.
For the diagnosis of heart sounds and heart murmurs, heart segmentation should be done. This document present an algorithm for segmenting the phonocardiogram signal based on wavelet denoising.
This allowed us to locate the sound S1and S2, and to extract the different systolic and diastolic murmurs.
The results are very satisfactory; this is equivalent to the power tools used in our algorithm, such that the energy envelope of Shannon, denoising by thresholding.
The choice of threshold is important so as to have interesting results; the duration measure of heart sounds or heart murmurs may change if the choice of threshold is not taken into consideration.Compared with the work carried out by other authors, our algorithm is able to not only separate the fundamental heart sounds S1 and S2, but also separate heart clicks or murmurs. Thus we can easily extract the features of each component of the PCG signal.
This study was not funded by any party: it is an academic PhD study
No conflict of interest
No animal or other used in this study
Clearly Auctoresonline and particularly Psychology and Mental Health Care Journal is dedicated to improving health care services for individuals and populations. The editorial boards' ability to efficiently recognize and share the global importance of health literacy with a variety of stakeholders. Auctoresonline publishing platform can be used to facilitate of optimal client-based services and should be added to health care professionals' repertoire of evidence-based health care resources.

Journal of Clinical Cardiology and Cardiovascular Intervention The submission and review process was adequate. However I think that the publication total value should have been enlightened in early fases. Thank you for all.

Journal of Women Health Care and Issues By the present mail, I want to say thank to you and tour colleagues for facilitating my published article. Specially thank you for the peer review process, support from the editorial office. I appreciate positively the quality of your journal.

Journal of Clinical Research and Reports I would be very delighted to submit my testimonial regarding the reviewer board and the editorial office. The reviewer board were accurate and helpful regarding any modifications for my manuscript. And the editorial office were very helpful and supportive in contacting and monitoring with any update and offering help. It was my pleasure to contribute with your promising Journal and I am looking forward for more collaboration.

We would like to thank the Journal of Thoracic Disease and Cardiothoracic Surgery because of the services they provided us for our articles. The peer-review process was done in a very excellent time manner, and the opinions of the reviewers helped us to improve our manuscript further. The editorial office had an outstanding correspondence with us and guided us in many ways. During a hard time of the pandemic that is affecting every one of us tremendously, the editorial office helped us make everything easier for publishing scientific work. Hope for a more scientific relationship with your Journal.

The peer-review process which consisted high quality queries on the paper. I did answer six reviewers’ questions and comments before the paper was accepted. The support from the editorial office is excellent.

Journal of Neuroscience and Neurological Surgery. I had the experience of publishing a research article recently. The whole process was simple from submission to publication. The reviewers made specific and valuable recommendations and corrections that improved the quality of my publication. I strongly recommend this Journal.

Dr. Katarzyna Byczkowska My testimonial covering: "The peer review process is quick and effective. The support from the editorial office is very professional and friendly. Quality of the Clinical Cardiology and Cardiovascular Interventions is scientific and publishes ground-breaking research on cardiology that is useful for other professionals in the field.

Thank you most sincerely, with regard to the support you have given in relation to the reviewing process and the processing of my article entitled "Large Cell Neuroendocrine Carcinoma of The Prostate Gland: A Review and Update" for publication in your esteemed Journal, Journal of Cancer Research and Cellular Therapeutics". The editorial team has been very supportive.

Testimony of Journal of Clinical Otorhinolaryngology: work with your Reviews has been a educational and constructive experience. The editorial office were very helpful and supportive. It was a pleasure to contribute to your Journal.

Dr. Bernard Terkimbi Utoo, I am happy to publish my scientific work in Journal of Women Health Care and Issues (JWHCI). The manuscript submission was seamless and peer review process was top notch. I was amazed that 4 reviewers worked on the manuscript which made it a highly technical, standard and excellent quality paper. I appreciate the format and consideration for the APC as well as the speed of publication. It is my pleasure to continue with this scientific relationship with the esteem JWHCI.

This is an acknowledgment for peer reviewers, editorial board of Journal of Clinical Research and Reports. They show a lot of consideration for us as publishers for our research article “Evaluation of the different factors associated with side effects of COVID-19 vaccination on medical students, Mutah university, Al-Karak, Jordan”, in a very professional and easy way. This journal is one of outstanding medical journal.

Dear Hao Jiang, to Journal of Nutrition and Food Processing We greatly appreciate the efficient, professional and rapid processing of our paper by your team. If there is anything else we should do, please do not hesitate to let us know. On behalf of my co-authors, we would like to express our great appreciation to editor and reviewers.

As an author who has recently published in the journal "Brain and Neurological Disorders". I am delighted to provide a testimonial on the peer review process, editorial office support, and the overall quality of the journal. The peer review process at Brain and Neurological Disorders is rigorous and meticulous, ensuring that only high-quality, evidence-based research is published. The reviewers are experts in their fields, and their comments and suggestions were constructive and helped improve the quality of my manuscript. The review process was timely and efficient, with clear communication from the editorial office at each stage. The support from the editorial office was exceptional throughout the entire process. The editorial staff was responsive, professional, and always willing to help. They provided valuable guidance on formatting, structure, and ethical considerations, making the submission process seamless. Moreover, they kept me informed about the status of my manuscript and provided timely updates, which made the process less stressful. The journal Brain and Neurological Disorders is of the highest quality, with a strong focus on publishing cutting-edge research in the field of neurology. The articles published in this journal are well-researched, rigorously peer-reviewed, and written by experts in the field. The journal maintains high standards, ensuring that readers are provided with the most up-to-date and reliable information on brain and neurological disorders. In conclusion, I had a wonderful experience publishing in Brain and Neurological Disorders. The peer review process was thorough, the editorial office provided exceptional support, and the journal's quality is second to none. I would highly recommend this journal to any researcher working in the field of neurology and brain disorders.
Dear Agrippa Hilda, Journal of Neuroscience and Neurological Surgery, Editorial Coordinator, I trust this message finds you well. I want to extend my appreciation for considering my article for publication in your esteemed journal. I am pleased to provide a testimonial regarding the peer review process and the support received from your editorial office. The peer review process for my paper was carried out in a highly professional and thorough manner. The feedback and comments provided by the authors were constructive and very useful in improving the quality of the manuscript. This rigorous assessment process undoubtedly contributes to the high standards maintained by your journal.

International Journal of Clinical Case Reports and Reviews. I strongly recommend to consider submitting your work to this high-quality journal. The support and availability of the Editorial staff is outstanding and the review process was both efficient and rigorous.

Thank you very much for publishing my Research Article titled “Comparing Treatment Outcome Of Allergic Rhinitis Patients After Using Fluticasone Nasal Spray And Nasal Douching" in the Journal of Clinical Otorhinolaryngology. As Medical Professionals we are immensely benefited from study of various informative Articles and Papers published in this high quality Journal. I look forward to enriching my knowledge by regular study of the Journal and contribute my future work in the field of ENT through the Journal for use by the medical fraternity. The support from the Editorial office was excellent and very prompt. I also welcome the comments received from the readers of my Research Article.

Dear Erica Kelsey, Editorial Coordinator of Cancer Research and Cellular Therapeutics Our team is very satisfied with the processing of our paper by your journal. That was fast, efficient, rigorous, but without unnecessary complications. We appreciated the very short time between the submission of the paper and its publication on line on your site.

I am very glad to say that the peer review process is very successful and fast and support from the Editorial Office. Therefore, I would like to continue our scientific relationship for a long time. And I especially thank you for your kindly attention towards my article. Have a good day!

"We recently published an article entitled “Influence of beta-Cyclodextrins upon the Degradation of Carbofuran Derivatives under Alkaline Conditions" in the Journal of “Pesticides and Biofertilizers” to show that the cyclodextrins protect the carbamates increasing their half-life time in the presence of basic conditions This will be very helpful to understand carbofuran behaviour in the analytical, agro-environmental and food areas. We greatly appreciated the interaction with the editor and the editorial team; we were particularly well accompanied during the course of the revision process, since all various steps towards publication were short and without delay".

I would like to express my gratitude towards you process of article review and submission. I found this to be very fair and expedient. Your follow up has been excellent. I have many publications in national and international journal and your process has been one of the best so far. Keep up the great work.

We are grateful for this opportunity to provide a glowing recommendation to the Journal of Psychiatry and Psychotherapy. We found that the editorial team were very supportive, helpful, kept us abreast of timelines and over all very professional in nature. The peer review process was rigorous, efficient and constructive that really enhanced our article submission. The experience with this journal remains one of our best ever and we look forward to providing future submissions in the near future.

I am very pleased to serve as EBM of the journal, I hope many years of my experience in stem cells can help the journal from one way or another. As we know, stem cells hold great potential for regenerative medicine, which are mostly used to promote the repair response of diseased, dysfunctional or injured tissue using stem cells or their derivatives. I think Stem Cell Research and Therapeutics International is a great platform to publish and share the understanding towards the biology and translational or clinical application of stem cells.

I would like to give my testimony in the support I have got by the peer review process and to support the editorial office where they were of asset to support young author like me to be encouraged to publish their work in your respected journal and globalize and share knowledge across the globe. I really give my great gratitude to your journal and the peer review including the editorial office.

I am delighted to publish our manuscript entitled "A Perspective on Cocaine Induced Stroke - Its Mechanisms and Management" in the Journal of Neuroscience and Neurological Surgery. The peer review process, support from the editorial office, and quality of the journal are excellent. The manuscripts published are of high quality and of excellent scientific value. I recommend this journal very much to colleagues.
Dr.Tania Muñoz, My experience as researcher and author of a review article in The Journal Clinical Cardiology and Interventions has been very enriching and stimulating. The editorial team is excellent, performs its work with absolute responsibility and delivery. They are proactive, dynamic and receptive to all proposals. Supporting at all times the vast universe of authors who choose them as an option for publication. The team of review specialists, members of the editorial board, are brilliant professionals, with remarkable performance in medical research and scientific methodology. Together they form a frontline team that consolidates the JCCI as a magnificent option for the publication and review of high-level medical articles and broad collective interest. I am honored to be able to share my review article and open to receive all your comments.

“The peer review process of JPMHC is quick and effective. Authors are benefited by good and professional reviewers with huge experience in the field of psychology and mental health. The support from the editorial office is very professional. People to contact to are friendly and happy to help and assist any query authors might have. Quality of the Journal is scientific and publishes ground-breaking research on mental health that is useful for other professionals in the field”.

Dear editorial department: On behalf of our team, I hereby certify the reliability and superiority of the International Journal of Clinical Case Reports and Reviews in the peer review process, editorial support, and journal quality. Firstly, the peer review process of the International Journal of Clinical Case Reports and Reviews is rigorous, fair, transparent, fast, and of high quality. The editorial department invites experts from relevant fields as anonymous reviewers to review all submitted manuscripts. These experts have rich academic backgrounds and experience, and can accurately evaluate the academic quality, originality, and suitability of manuscripts. The editorial department is committed to ensuring the rigor of the peer review process, while also making every effort to ensure a fast review cycle to meet the needs of authors and the academic community. Secondly, the editorial team of the International Journal of Clinical Case Reports and Reviews is composed of a group of senior scholars and professionals with rich experience and professional knowledge in related fields. The editorial department is committed to assisting authors in improving their manuscripts, ensuring their academic accuracy, clarity, and completeness. Editors actively collaborate with authors, providing useful suggestions and feedback to promote the improvement and development of the manuscript. We believe that the support of the editorial department is one of the key factors in ensuring the quality of the journal. Finally, the International Journal of Clinical Case Reports and Reviews is renowned for its high- quality articles and strict academic standards. The editorial department is committed to publishing innovative and academically valuable research results to promote the development and progress of related fields. The International Journal of Clinical Case Reports and Reviews is reasonably priced and ensures excellent service and quality ratio, allowing authors to obtain high-level academic publishing opportunities in an affordable manner. I hereby solemnly declare that the International Journal of Clinical Case Reports and Reviews has a high level of credibility and superiority in terms of peer review process, editorial support, reasonable fees, and journal quality. Sincerely, Rui Tao.

Clinical Cardiology and Cardiovascular Interventions I testity the covering of the peer review process, support from the editorial office, and quality of the journal.

Clinical Cardiology and Cardiovascular Interventions, we deeply appreciate the interest shown in our work and its publication. It has been a true pleasure to collaborate with you. The peer review process, as well as the support provided by the editorial office, have been exceptional, and the quality of the journal is very high, which was a determining factor in our decision to publish with you.

The peer reviewers process is quick and effective, the supports from editorial office is excellent, the quality of journal is high. I would like to collabroate with Internatioanl journal of Clinical Case Reports and Reviews journal clinically in the future time.

Clinical Cardiology and Cardiovascular Interventions, I would like to express my sincerest gratitude for the trust placed in our team for the publication in your journal. It has been a true pleasure to collaborate with you on this project. I am pleased to inform you that both the peer review process and the attention from the editorial coordination have been excellent. Your team has worked with dedication and professionalism to ensure that your publication meets the highest standards of quality. We are confident that this collaboration will result in mutual success, and we are eager to see the fruits of this shared effort.

Dear Dr. Jessica Magne, Editorial Coordinator 0f Clinical Cardiology and Cardiovascular Interventions, I hope this message finds you well. I want to express my utmost gratitude for your excellent work and for the dedication and speed in the publication process of my article titled "Navigating Innovation: Qualitative Insights on Using Technology for Health Education in Acute Coronary Syndrome Patients." I am very satisfied with the peer review process, the support from the editorial office, and the quality of the journal. I hope we can maintain our scientific relationship in the long term.

Dear Monica Gissare, - Editorial Coordinator of Nutrition and Food Processing. ¨My testimony with you is truly professional, with a positive response regarding the follow-up of the article and its review, you took into account my qualities and the importance of the topic¨.

Dear Dr. Jessica Magne, Editorial Coordinator 0f Clinical Cardiology and Cardiovascular Interventions, The review process for the article “The Handling of Anti-aggregants and Anticoagulants in the Oncologic Heart Patient Submitted to Surgery” was extremely rigorous and detailed. From the initial submission to the final acceptance, the editorial team at the “Journal of Clinical Cardiology and Cardiovascular Interventions” demonstrated a high level of professionalism and dedication. The reviewers provided constructive and detailed feedback, which was essential for improving the quality of our work. Communication was always clear and efficient, ensuring that all our questions were promptly addressed. The quality of the “Journal of Clinical Cardiology and Cardiovascular Interventions” is undeniable. It is a peer-reviewed, open-access publication dedicated exclusively to disseminating high-quality research in the field of clinical cardiology and cardiovascular interventions. The journal's impact factor is currently under evaluation, and it is indexed in reputable databases, which further reinforces its credibility and relevance in the scientific field. I highly recommend this journal to researchers looking for a reputable platform to publish their studies.

Dear Editorial Coordinator of the Journal of Nutrition and Food Processing! "I would like to thank the Journal of Nutrition and Food Processing for including and publishing my article. The peer review process was very quick, movement and precise. The Editorial Board has done an extremely conscientious job with much help, valuable comments and advices. I find the journal very valuable from a professional point of view, thank you very much for allowing me to be part of it and I would like to participate in the future!”

Dealing with The Journal of Neurology and Neurological Surgery was very smooth and comprehensive. The office staff took time to address my needs and the response from editors and the office was prompt and fair. I certainly hope to publish with this journal again.Their professionalism is apparent and more than satisfactory. Susan Weiner

My Testimonial Covering as fellowing: Lin-Show Chin. The peer reviewers process is quick and effective, the supports from editorial office is excellent, the quality of journal is high. I would like to collabroate with Internatioanl journal of Clinical Case Reports and Reviews.

My experience publishing in Psychology and Mental Health Care was exceptional. The peer review process was rigorous and constructive, with reviewers providing valuable insights that helped enhance the quality of our work. The editorial team was highly supportive and responsive, making the submission process smooth and efficient. The journal's commitment to high standards and academic rigor makes it a respected platform for quality research. I am grateful for the opportunity to publish in such a reputable journal.

My experience publishing in International Journal of Clinical Case Reports and Reviews was exceptional. I Come forth to Provide a Testimonial Covering the Peer Review Process and the editorial office for the Professional and Impartial Evaluation of the Manuscript.

I would like to offer my testimony in the support. I have received through the peer review process and support the editorial office where they are to support young authors like me, encourage them to publish their work in your esteemed journals, and globalize and share knowledge globally. I really appreciate your journal, peer review, and editorial office.

Dear Agrippa Hilda- Editorial Coordinator of Journal of Neuroscience and Neurological Surgery, "The peer review process was very quick and of high quality, which can also be seen in the articles in the journal. The collaboration with the editorial office was very good."

I would like to express my sincere gratitude for the support and efficiency provided by the editorial office throughout the publication process of my article, “Delayed Vulvar Metastases from Rectal Carcinoma: A Case Report.” I greatly appreciate the assistance and guidance I received from your team, which made the entire process smooth and efficient. The peer review process was thorough and constructive, contributing to the overall quality of the final article. I am very grateful for the high level of professionalism and commitment shown by the editorial staff, and I look forward to maintaining a long-term collaboration with the International Journal of Clinical Case Reports and Reviews.

To Dear Erin Aust, I would like to express my heartfelt appreciation for the opportunity to have my work published in this esteemed journal. The entire publication process was smooth and well-organized, and I am extremely satisfied with the final result. The Editorial Team demonstrated the utmost professionalism, providing prompt and insightful feedback throughout the review process. Their clear communication and constructive suggestions were invaluable in enhancing my manuscript, and their meticulous attention to detail and dedication to quality are truly commendable. Additionally, the support from the Editorial Office was exceptional. From the initial submission to the final publication, I was guided through every step of the process with great care and professionalism. The team's responsiveness and assistance made the entire experience both easy and stress-free. I am also deeply impressed by the quality and reputation of the journal. It is an honor to have my research featured in such a respected publication, and I am confident that it will make a meaningful contribution to the field.

"I am grateful for the opportunity of contributing to [International Journal of Clinical Case Reports and Reviews] and for the rigorous review process that enhances the quality of research published in your esteemed journal. I sincerely appreciate the time and effort of your team who have dedicatedly helped me in improvising changes and modifying my manuscript. The insightful comments and constructive feedback provided have been invaluable in refining and strengthening my work".

I thank the ‘Journal of Clinical Research and Reports’ for accepting this article for publication. This is a rigorously peer reviewed journal which is on all major global scientific data bases. I note the review process was prompt, thorough and professionally critical. It gave us an insight into a number of important scientific/statistical issues. The review prompted us to review the relevant literature again and look at the limitations of the study. The peer reviewers were open, clear in the instructions and the editorial team was very prompt in their communication. This journal certainly publishes quality research articles. I would recommend the journal for any future publications.

Dear Jessica Magne, with gratitude for the joint work. Fast process of receiving and processing the submitted scientific materials in “Clinical Cardiology and Cardiovascular Interventions”. High level of competence of the editors with clear and correct recommendations and ideas for enriching the article.

We found the peer review process quick and positive in its input. The support from the editorial officer has been very agile, always with the intention of improving the article and taking into account our subsequent corrections.

My article, titled 'No Way Out of the Smartphone Epidemic Without Considering the Insights of Brain Research,' has been republished in the International Journal of Clinical Case Reports and Reviews. The review process was seamless and professional, with the editors being both friendly and supportive. I am deeply grateful for their efforts.

To Dear Erin Aust – Editorial Coordinator of Journal of General Medicine and Clinical Practice! I declare that I am absolutely satisfied with your work carried out with great competence in following the manuscript during the various stages from its receipt, during the revision process to the final acceptance for publication. Thank Prof. Elvira Farina

Dear Jessica, and the super professional team of the ‘Clinical Cardiology and Cardiovascular Interventions’ I am sincerely grateful to the coordinated work of the journal team for the no problem with the submission of my manuscript: “Cardiometabolic Disorders in A Pregnant Woman with Severe Preeclampsia on the Background of Morbid Obesity (Case Report).” The review process by 5 experts was fast, and the comments were professional, which made it more specific and academic, and the process of publication and presentation of the article was excellent. I recommend that my colleagues publish articles in this journal, and I am interested in further scientific cooperation. Sincerely and best wishes, Dr. Oleg Golyanovskiy.

Dear Ashley Rosa, Editorial Coordinator of the journal - Psychology and Mental Health Care. " The process of obtaining publication of my article in the Psychology and Mental Health Journal was positive in all areas. The peer review process resulted in a number of valuable comments, the editorial process was collaborative and timely, and the quality of this journal has been quickly noticed, resulting in alternative journals contacting me to publish with them." Warm regards, Susan Anne Smith, PhD. Australian Breastfeeding Association.

Dear Jessica Magne, Editorial Coordinator, Clinical Cardiology and Cardiovascular Interventions, Auctores Publishing LLC. I appreciate the journal (JCCI) editorial office support, the entire team leads were always ready to help, not only on technical front but also on thorough process. Also, I should thank dear reviewers’ attention to detail and creative approach to teach me and bring new insights by their comments. Surely, more discussions and introduction of other hemodynamic devices would provide better prevention and management of shock states. Your efforts and dedication in presenting educational materials in this journal are commendable. Best wishes from, Farahnaz Fallahian.

Dear Maria Emerson, Editorial Coordinator, International Journal of Clinical Case Reports and Reviews, Auctores Publishing LLC. I am delighted to have published our manuscript, "Acute Colonic Pseudo-Obstruction (ACPO): A rare but serious complication following caesarean section." I want to thank the editorial team, especially Maria Emerson, for their prompt review of the manuscript, quick responses to queries, and overall support. Yours sincerely Dr. Victor Olagundoye.

Dear Ashley Rosa, Editorial Coordinator, International Journal of Clinical Case Reports and Reviews. Many thanks for publishing this manuscript after I lost confidence the editors were most helpful, more than other journals Best wishes from, Susan Anne Smith, PhD. Australian Breastfeeding Association.

Dear Agrippa Hilda, Editorial Coordinator, Journal of Neuroscience and Neurological Surgery. The entire process including article submission, review, revision, and publication was extremely easy. The journal editor was prompt and helpful, and the reviewers contributed to the quality of the paper. Thank you so much! Eric Nussbaum, MD
Dr Hala Al Shaikh This is to acknowledge that the peer review process for the article ’ A Novel Gnrh1 Gene Mutation in Four Omani Male Siblings, Presentation and Management ’ sent to the International Journal of Clinical Case Reports and Reviews was quick and smooth. The editorial office was prompt with easy communication.

Dear Erin Aust, Editorial Coordinator, Journal of General Medicine and Clinical Practice. We are pleased to share our experience with the “Journal of General Medicine and Clinical Practice”, following the successful publication of our article. The peer review process was thorough and constructive, helping to improve the clarity and quality of the manuscript. We are especially thankful to Ms. Erin Aust, the Editorial Coordinator, for her prompt communication and continuous support throughout the process. Her professionalism ensured a smooth and efficient publication experience. The journal upholds high editorial standards, and we highly recommend it to fellow researchers seeking a credible platform for their work. Best wishes By, Dr. Rakhi Mishra.

Dear Jessica Magne, Editorial Coordinator, Clinical Cardiology and Cardiovascular Interventions, Auctores Publishing LLC. The peer review process of the journal of Clinical Cardiology and Cardiovascular Interventions was excellent and fast, as was the support of the editorial office and the quality of the journal. Kind regards Walter F. Riesen Prof. Dr. Dr. h.c. Walter F. Riesen.

Dear Ashley Rosa, Editorial Coordinator, International Journal of Clinical Case Reports and Reviews, Auctores Publishing LLC. Thank you for publishing our article, Exploring Clozapine's Efficacy in Managing Aggression: A Multiple Single-Case Study in Forensic Psychiatry in the international journal of clinical case reports and reviews. We found the peer review process very professional and efficient. The comments were constructive, and the whole process was efficient. On behalf of the co-authors, I would like to thank you for publishing this article. With regards, Dr. Jelle R. Lettinga.

Dear Clarissa Eric, Editorial Coordinator, Journal of Clinical Case Reports and Studies, I would like to express my deep admiration for the exceptional professionalism demonstrated by your journal. I am thoroughly impressed by the speed of the editorial process, the substantive and insightful reviews, and the meticulous preparation of the manuscript for publication. Additionally, I greatly appreciate the courteous and immediate responses from your editorial office to all my inquiries. Best Regards, Dariusz Ziora

Dear Chrystine Mejia, Editorial Coordinator, Journal of Neurodegeneration and Neurorehabilitation, Auctores Publishing LLC, We would like to thank the editorial team for the smooth and high-quality communication leading up to the publication of our article in the Journal of Neurodegeneration and Neurorehabilitation. The reviewers have extensive knowledge in the field, and their relevant questions helped to add value to our publication. Kind regards, Dr. Ravi Shrivastava.

Dear Clarissa Eric, Editorial Coordinator, Journal of Clinical Case Reports and Studies, Auctores Publishing LLC, USA Office: +1-(302)-520-2644. I would like to express my sincere appreciation for the efficient and professional handling of my case report by the ‘Journal of Clinical Case Reports and Studies’. The peer review process was not only fast but also highly constructive—the reviewers’ comments were clear, relevant, and greatly helped me improve the quality and clarity of my manuscript. I also received excellent support from the editorial office throughout the process. Communication was smooth and timely, and I felt well guided at every stage, from submission to publication. The overall quality and rigor of the journal are truly commendable. I am pleased to have published my work with Journal of Clinical Case Reports and Studies, and I look forward to future opportunities for collaboration. Sincerely, Aline Tollet, UCLouvain.

Dear Ms. Mayra Duenas, Editorial Coordinator, International Journal of Clinical Case Reports and Reviews. “The International Journal of Clinical Case Reports and Reviews represented the “ideal house” to share with the research community a first experience with the use of the Simeox device for speech rehabilitation. High scientific reputation and attractive website communication were first determinants for the selection of this Journal, and the following submission process exceeded expectations: fast but highly professional peer review, great support by the editorial office, elegant graphic layout. Exactly what a dynamic research team - also composed by allied professionals - needs!" From, Chiara Beccaluva, PT - Italy.