Research Article | DOI: https://doi.org/10.31579/ 2690-8816/148
*Corresponding Author: H. Salar Amoli. Department of Chemistry, Amirkabir University of Technology, Tehran, IR: Iran.
Citation: F. Hadadzadeh1, S. A. Frozandeh1, H. Salar Amoli*1, (2024), Fabrication of a novel aptasensor based on paper carbon/gold nanoparticles/ reduced graphene oxide for early detection of hematuria, J Clinical Research Notes, 5(5); DOI:10.31579/ 2690-8816/148
Copyright: © 2024, H. Salar Amoli. This is an open access article distributed under the Creative Commons Attribution License, which permits unrestricted use, distribution, and reproduction in any medium, provided the original work is properly cited.
Received: 15 October 2024 | Accepted: 23 October 2024 | Published: 01 November 2024
Keywords: aprtasensor; hematuria; paper carbon; gold nanoparticles; reduced graphene oxide, urine.
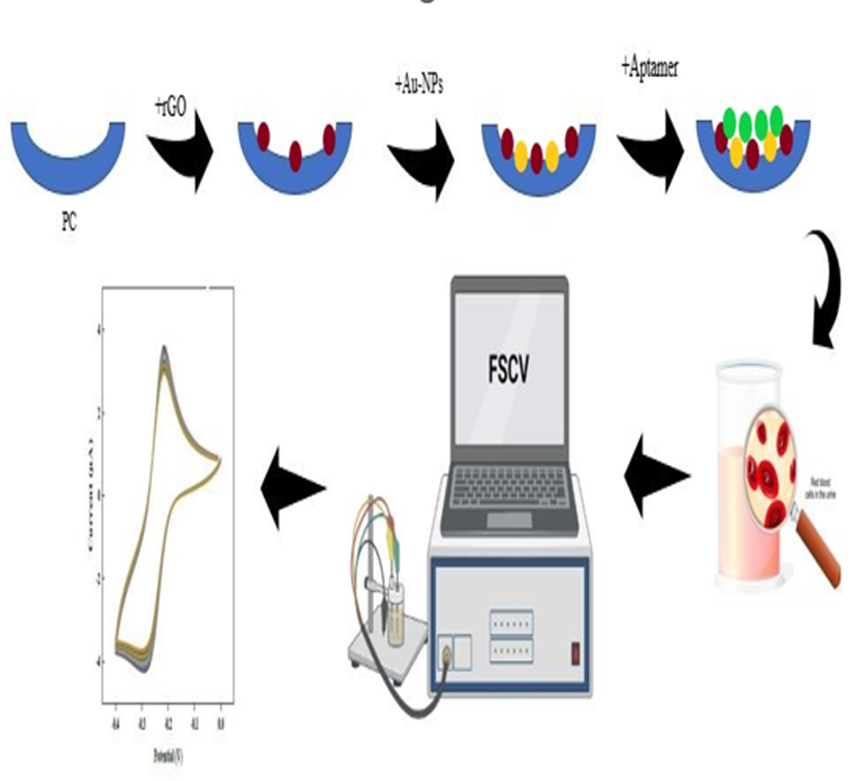
Aptasensors are among the methods that can be used with high speed and accuracy for early and timely diagnosis of hematuria (early detection of blood in urine). The main objective of this research was a fast and accurate identification of red blood cells in urine. For these purposes, a new biosensor based on specific aptamer-hemoglobin, paper carbon (PC), gold nanoparticles (Au-NPs) and reduced grapheme oxide (rGO) have been designed and fabricated. UV-Vis spectroscopy, FT-IR, and scanning electron microscopy (SEM) have been used to investigate and characterize the synthesized materials. Modified electrodes have also been characterized using cyclic voltammetry (CV) and electrochemical impedance spectroscopy (EIS). Real urine samples containing hemoglobin and pure hemoglobin as reference, have been analyzed to evaluate the selectivity of the aptasensor and the fabricated sensor. The aptasensor is based on electrochemical methods, and the use of gold nanoparticles and reduced grapheme oxides in its design aims to enhance electron transfer, resulting in more accurate and reliable responses. The aptasensor exhibits the best performance at pH 7. The obtained response time was 25 min, and the detection limit of 0.05 µg/mL and a shelf life of 1 month has been achieved.
Hematuria is a common phenomenon, especially among children, and is often perceived as an incidental finding in urine tests. In such cases, initial symptoms go unnoticed, leading to acute complications. In these circumstances, children or adolescents with hematuria require radiographic imaging or initial urological interventions, such as cystoscopy [1].
Hematuria is a term derived from the Greek words "haima" meaning blood and "ouron" meaning urine. The presence of blood in urine cannot be visible to the naked eye and can only be observed under a microscope (microscopic hematuria). Hematuria is defined as the presence of five or more red blood cells (RBCs) after three consecutive freshly centrifuged samples in high-power fields. A positive urine test can be caused by myoglobinuria or hemoglobinuria, which can change the color of urine without any red blood cells being observed in microscopic evaluations [2-4]. Additionally, certain medications (sulfonamides, nitrofurantoin, salicylates, phenazopyridine, phenolphthalein), toxins (lead, benzene), and foods (food colorings, beets, rhubarb, berries, paprika) may falsely discolor urine. In infants, when urate crystals precipitate in the urine, a reddish or pinkish color may be seen in the diaper [5]. One of the most common causes of hematuria is lower urinary tract infection, particularly urinary tract and bladder infections (bladder stones). In older patients, the causes of this condition can be cancerous glands or prostatic hyperplasia. In younger patients, hematuria can be caused by kidney problems, and failure to timely diagnose it can lead to more significant issues [6].
Achieving success in treating diseases requires the development of methods for rapid and accurate detection. Accurate measurement and evaluation of diseases in clinical diagnosis are of utmost importance. Although there are multiple methods available and in use in this field, there is still a noticeable lack of suitable, rapid, selective, and cost-effective measurement and analysis methods. Electrochemical sensors, especially biosensors, offer attractive analytical characteristics and hold promising options for future clinical diagnostics. However, several issues that need to be addressed and resolved before these methods can be used for on-site diagnostics [7,8]. The design of biosensors is such that they can specifically react with a particular substance. The result of this reaction comes in the form of messages that microprocessor can analyze.
A biosensor can be defined as a quantitative or semi-quantitative analytical device that consists of a biological sensing element connected to or combined with a transducer, converting a biological signal into a measurable electrical signal. The construction of biosensors involves the expertise and experience of various scientific fields such as biochemistry, immunology, optical physics, electrochemistry, electronics, etc. [9].
The concept of biosensors was first introduced by Leland C. Clark in the early 1960s. He used an enzyme electrode to measure the concentration of glucose for diabetic patients, utilizing the enzyme glucose oxidase. The development of biosensors began in 1962 with the construction of an oxygen electrode by Clark at the Cincinnati Synthetics in the United States, for measuring the concentration of dissolved oxygen in blood. This sensor is also sometimes referred to as the Clark electrode. Later, by coating the electrode surface with an enzyme that aided in the glucose oxidation, this sensor was used for measuring blood glucose levels [10].
To comprehensively evaluate and assess the performance of biosensors, it's essential to consider multiple criteria. These include selectivity, limit of detection, precision, solution conditions, response time, pH sensitivity, operational lifetime, stability, and reproducibility [11].
Protein biomarkers are likely the most common type of biomarkers that are evaluated through molecular diagnostics. Various diseases can release specific proteins into the bloodstream or urine. These proteins can then be assessed by taking a blood or urine sample and subjecting it to a molecular diagnostic test. Some of the most important protein biomarkers for disease detection, especially cancer, include alpha-fetoprotein, cancer antigen 125, cancer antigen 153, cancer antigen 19, carcinoembryonic antigen, epidermal growth factor receptor, human epidermal growth factor receptor 2, interleukins, prostate-specific antigen, squamous cell carcinoma antigen, tumor necrosis factor-alpha, and vascular endothelial growth factor [ 12, 13]. However, in hematuria, blood is observed in the urine of the patient. The most common method for investigating hematuria is urine analysis. Urine analysis aims to detect red blood cells, protein, glucose, and any signs of inflammation or infection [ 14,15]. However, the common methods are time-consuming and prone to errors. In the field of biosensors, the interaction between biological receptors and analytes through thermal, optical, and electrochemical signals can be used for disease identification [16].
Aptamers, discovered in 1990, are single-stranded DNA or RNA sequences with high affinity for specific target molecules. They bind through a lock-and-key mechanism. Unlike antibodies, aptamers boast simplicity in production, reproducibility, and a diverse functional environment. Their numerous benefits, including cost-effectiveness and broad applications, make them valuable in biosensor design [17-20].
Recently, much attention has been focused on the development of nanomaterials in the production of biosensors. Nanomaterials are used as a platform for immobilizing biomolecules on surfaces, and on the other hand, nanoparticles can be attached to the sensing element and used for detecting or amplifying of various signals [21]. Nanoparticles have a very high surface-to-volume ratio, which increases their ability to interact with any surface. They exhibit unique physical and chemical properties at this scale that make them highly intriguing [22].
Also, in recent years, there has been a significant increase in the use of gold nanoparticles (AuNPs) for creating colorimetric, fluorescent, and electrochemical aptasensors. This is due to their unique characteristics, such as their large surface area, ease of synthesis and functionalization, good biocompatibility, and distinct electronic and optical properties. Various research groups have been focusing on combining the advantages of both AuNPs and aptamers to develop innovative aptasensors [23-25]. Scientists will utilize the stable immobilization and preservation of biological activity provided by gold nanoparticles. Furthermore, utilizing a nanostructured gold surface rather than a standard gold surface offers advantages such as enhanced electron transfer and a larger surface area for additional modifications. Previous investigations have successfully developed biosensors on screen-printed carbon electrodes that were modified with gold nanoparticles, demonstrating their effectiveness in detecting analytes at low concentrations [26, 27].
Recently various methods have been proposed for the measurement of hemoglobin using aptamers. These methods include sandwich assays [28] as well as label-free approaches [29]. However, the label-free assays developed thus far have not proven to be highly effective in detecting hemoglobin at low concentrations. In this study, we introduce a rapid method for measuring hemoglobin in urine, utilizing cyclic voltammetry (CV). Our biosensor incorporates gold nanoparticles (AuNPs) as an anchoring platform and a truncated aptamer with a high affinity for the target analyte [30]. In this research for the first time, a biosensor of aptamer-hemoglobin/ paper carbon/gold nanoparticle/ reduced graphene oxide has been fabricated for early detection of blood in urine.
2.1. Materials
Sodium citrate (Na3C6H5O7), chloroauric acid (HAuCl4), trimethylamine hydrochloride (NH2C(CH2OH)3. HCl), 2-amino, 2-hydroxy methyl, 1,3-propanediol (NH2C(CH2OH)3), disodium phosphate (Na2PO4), potassium dihydrogen phosphate (KH2PO4), potassium ferrocyanide (K4F e(CN)6), potassium ferricyanide (K3F e(CN)6), mercaptoethanol (C2H6OS), sulfuric acid (H2SO4, 98%), aniline (C6H5NH2), and hydrazine (N2H4) were procured from Sigma-Aldrich and utilized as received without any additional purification. Distilled water (DI water) obtained from Thermo Fisher, USA, was utilized in all conducted experiments. The Hb aptamer (Kd = 2.8 nM) was manufactured by Bio Basic Inc (Canada, https://www.biobasic.com). The aptamer with thiol modification is 5′HS− (CH2)6/ ACGCACACCAGAGACAAGTAGCCCCCCAAACGCGGCCACGGAACGCAGCACCTCCA TGGC -3′.
2.2. Apparatus
Fourier transform infrared (FTIR) spectrometry was conducted using a Nicolet Nexus 670 spectrometer from Thermo Fisher in the United States. A scanning electron microscope (SEM, MIRA3 TESCAN) was utilized to investigate the morphology of nanomaterials. Electrochemical studies, including cyclic voltammetry (CV), electrochemical impedance spectroscopy (EIS), and square wave voltammetry (SWV) were conducted using an Ivium Technologies potentiostat/galvanostat instrument from the Netherlands (https://www.ivium.com). The experiments were performed in a solution containing a 0.2 mM [Fe(CN)6]-3/-4 redox probe and 0.1 M PBS. All electrochemical tests were conducted using a three-electrode system. The working electrode consisted of a gold electrode with a radius of 1 mm. The counter electrode was made of platinum, and the reference electrode used was Ag/AgCl. Electrochemical impedance spectroscopy (EIS) tests were conducted over a frequency range of 10 kHz to 100 mHz. A perturbation amplitude of 0.22V was applied at the potential corresponding to the oxidation peak current observed in the cyclic voltammetry (CV) curves. All analyses were performed at room temperature.
2.3 Methods
2.3.1. Synthesis of rGO
The Hummers' method was used for the synthesis of graphene oxide. To begin the process, a glass container was placed inside an ice bath. The temperature was maintained 13°C throughout this stage, monitored using a thermometer. Then, 56 mL of 38% sulfuric acid was poured into the container, followed by the addition of 2 g of pure graphite. The mixture was stirred vigorously for 14 minutes. Subsequently, 6 g of potassium permanganate powder was slowly added to the mixture while stirring intensively for 1.5 hours. After completion, the stirring continued for an additional 30 minutes. The temperature of the bath was increased to 35°C, and after reaching thermal stability, stirring was continued for approximately one hour. To dilute the mixture, 100 mL of distilled water was cautiously added to the container, and the stirrer was turned off. Then, 300 mL of distilled water was poured into a larger container, and the contents of the initial container were slowly transferred to the larger one. Stirring was carried out for 30 minutes. The temperature of the bath should not exceed 40°C during this stage. After dilution with distilled water, 20 mL of 30% hydrogen peroxide was gently added to the container, and stirring continued for half an hour. At this stage, the color of the solution briefly changes to bright yellow. The mixture was then washed to remove ions and increase the pH by adding 10% HCl and distilled water, followed by stirring (centrifugation at 14,000 rpm for one hour). The container was then left undisturbed for approximately 4 hours to allow sedimentation of the materials. Subsequently, the mixture was placed in an oven at 50°C for 4 hours. The resulting powder is graphene oxide [31].
To prepare reduced graphene oxide, 3.0 mg/mL of graphene oxide was dissolved in 1 mL of distilled water. Then, 200 μL of aniline and 1 mL of hydrazine were added to the solution. The resulting solution was placed on a magnetic stirrer for 30 minutes and then heated at 100°C for one hour while stirring. Next, the desired reduced graphene oxide was synthesized, and to separate the remaining aniline and hydrazine, the solution was centrifuged, allowing the aniline and hydrazine to be separated from the reduced graphene oxide particles. It is worth mentioning that in this process, hydrazine acts as a reducing agent, while aniline serves as a catalyst.
2.3.2. Synthesis of Au-NPs
Au-NPs are prepared by using a solution of Na3C6H5O7. The Na3C6H5O7 solution is prepared by dissolving 1 g of Na3C6H5O7 in 100 mL of distilled water. Then, 0.1 g of HAuCl4·3H2O is added to a round-bottom flask and the volume is brought to 100 mL with distilled water. The solution is then heated to 100 on a heater until it turns yellow. Once the HAuCl4·3H2O solution starts boiling, 2 mL of the prepared Na3C6H5O7 solution are added to it. At this stage, the gold particles are transformed into nanoparticles, and the solution turns purple within a few seconds. To further reduce the size of the gold colloid particles, the solution should be boiled for 17 minutes until the color changes from purple to red. After that, the gold solution is removed from the heater and allowed to cool to room temperature. To preserve the gold solution, it should be well covered to prevent any exposure to light.
2.3.3. Preparation of Aptasensor
To prepare the aptasensor buffer, 1.460 g of NaCl dissolved in 25 mL. distilled water. Then, 0.354 g of Na2HPO4 dissolved in 25 mL distilled water. These two solutions should be combined, and then the KH2PO4 solution should be added drop by drop. After preparing the mentioned solutions, the biosensor fabrication process is initiated. Drop casting method is used for the deposition of the prepared layers. After heating the carbon papers to purify them from any contamination, approximately 50 L of rGO solution is placed on it at room temperature and away from any light. Once the mentioned drop is dried, 50 L of Au-NPs solution is placed on it. This step is repeated once more, and then 10 L of aptamer buffer is also placed on it. After drying for 12 hours, 10 L of mercaptoethanol solution is placed on the deposited layer, the resulting aptasensor is washed with distilled water. To preserve the resulting aptasensor, it should be stored in aptasensor buffer solution at a temperature of 3. The resulting aptasensor has a shelf life of one month.
2.3.4. Real Sample Analysis
The analysis was conducted using human urine samples collected from Boghrat Laboratory (Tehran, Iran). The samples were subsequently stored in test tubes at a temperature of 3 °C until the time of testing. Before the analysis, all human blood samples were gently agitated at room temperature.
3.1. Characterization of Synthesized Materials
An FT-IR instrument was used to identify the functional groups of GO and rGO and confirm the synthesis of these materials. Fig. 1(a) shows the spectrum of GO. In this spectrum, we observe an absorption peak at 3400 cm-1. This absorption indicates the presence of the functional group O-H, which is characteristic of carboxylic acid [32,33]. The absorption peak at 2855 cm-1 and 2922 cm-1 respectively indicates the presence of symmetric and asymmetric CH2 groups. The absorption peak at 1627 cm-1 represents the C=C functional group of the unoxidized graphite groups [33,34]. The peak around 1721 cm-1 indicates the presence of the C=O functional group [35]. Fig. 1(b) represents the spectrum of rGO. According to this figure, the intensity of absorption peaks has decreased, but they have not completely disappeared. This means that the reduced graphene oxide has been synthesized correctly, but its reduction may not be 100% complete [36].
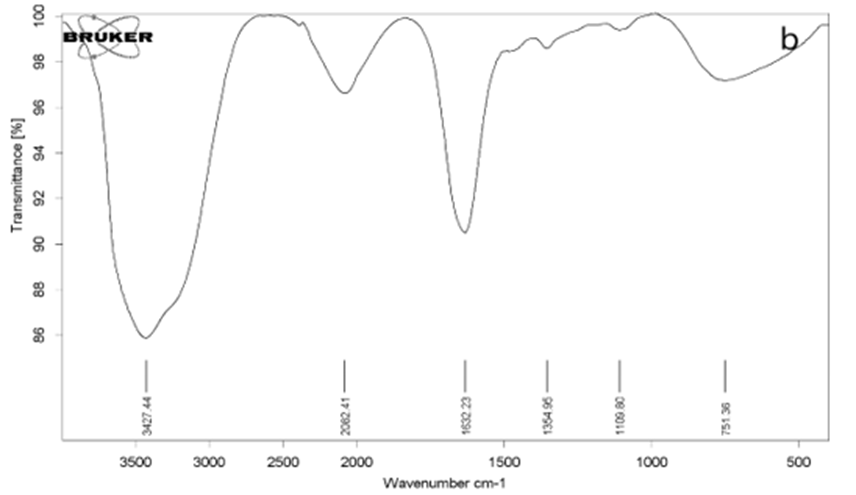
Fig. 1. FT-IR analysis of graphene oxide and reduced graphene oxide: a) GO, b) rGO, (b)
Also, UV-vis studies have been carried out. As Fig 2 illustrating, GO exhibits an absorption band at 230 nm, corresponding to the π - π * transition. However, for rGO, the peak shifts to 277 nm, indicating the removal of some functional groups on the surface of GO and the restoration of its structure [37,38]. The nanoparticles were prepared by reducing HAuCl4 with citrate as the reducing agent. As shown in Fig. 2(b), upon heating, the pale-yellow solution gradually changed to a dark purple color, confirming the production of gold nanoparticles. With increasing heating time, the solution gradually turned red. The color change is primarily due to light absorption and particle size. As the size of the nanoparticles decreases, they absorb shorter wavelengths of light, resulting in a reflected red color. The absorption peak also followed a similar trend. With increasing processing time, the absorption peak shifted towards shorter wavelengths, and we observe an absorption peak at 566 nm [39].
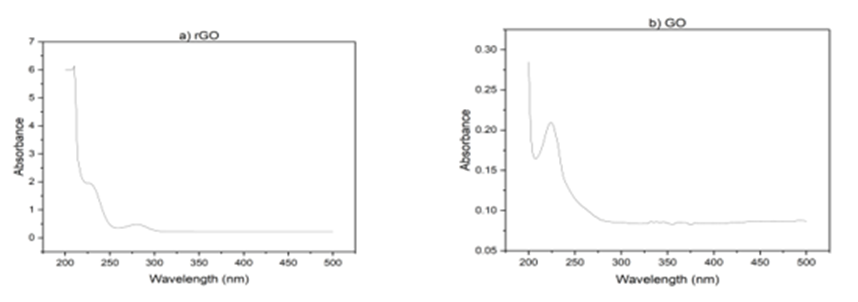
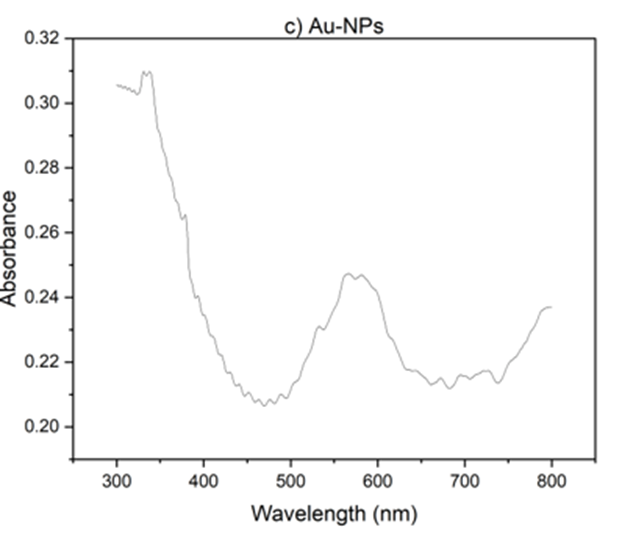
Fig 2. Uv- V is absorption spectra a) r GO, b) Go, C) Au-Nps
The morphological features of rGO, Au-NPs, and aptamers were meticulously examined using SEM, as presented in Fig. 3. In Fig. 3(a), discernible enhancement in the formation of rGO sheets is observed, highlighting improved porosity. Figs. 3(b) and 3(c) vividly illustrate the spherical configuration of gold nanoparticles, providing valuable insights into their dimensions. The successful synthesis of Au-NPs is evident based on the dimensions portrayed in the figure. Fig. 3(d) illustrates the surface morphology of the aptamer. In Fig. 2(e), although the aptamer is placed on the surface of gold nanoparticles, some areas with incomplete coverage allow the nanoparticles to be clearly seen. However, Fig. 2(f) shows complete coverage, where the larger size of the aptamer molecules compared to Au-NPs hinders the observation of the spherical particles The purpose of conducting the SEM test is to examine the uniform and distinct distribution of particles, which is essential for confirming the characteristics of the synthesized nanoparticles [40,41].
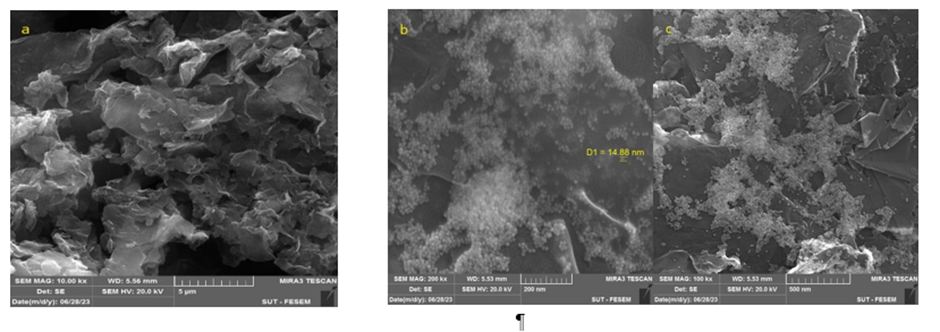
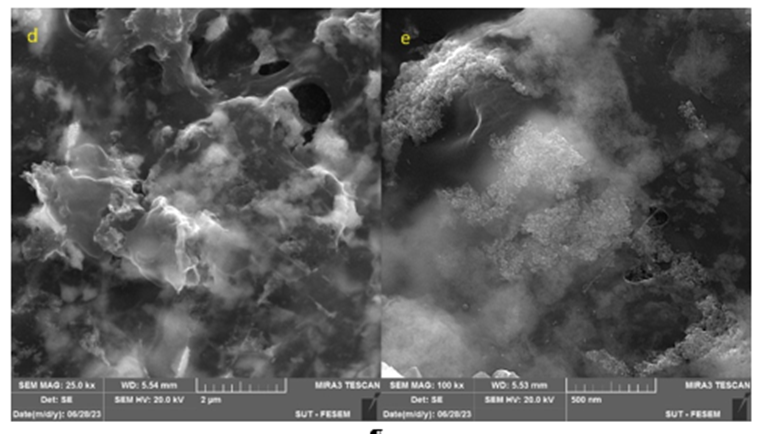
Fig. 3. SEM analysis: a) PC/rGO, b and c) PC/rGO/Au-NPs, d and e) PC/rGO/Au-NPs/Aptamer
3.2. Electrochemical Characterization
3.2.1. Characterization of sensing interface
Electrochemical impedance spectroscopy in the frequency range of 0.1 to 100,000 Hz was used to investigate the modified electrode. The studies involved rGO electrodes, rGO electrodes with Au-NPs, and aptamer-functionalized sensor in a 2.0 M ferrocyanide environment. The results of the electrochemical impedance spectroscopy test (Fig. 4) indicate that adding rGO increases the electrode surface resistance compared to the bare surface condition. Additionally, adding Au-NPs decreases the surface resistance, while adding aptamer and analyte increases the surface resistance again.
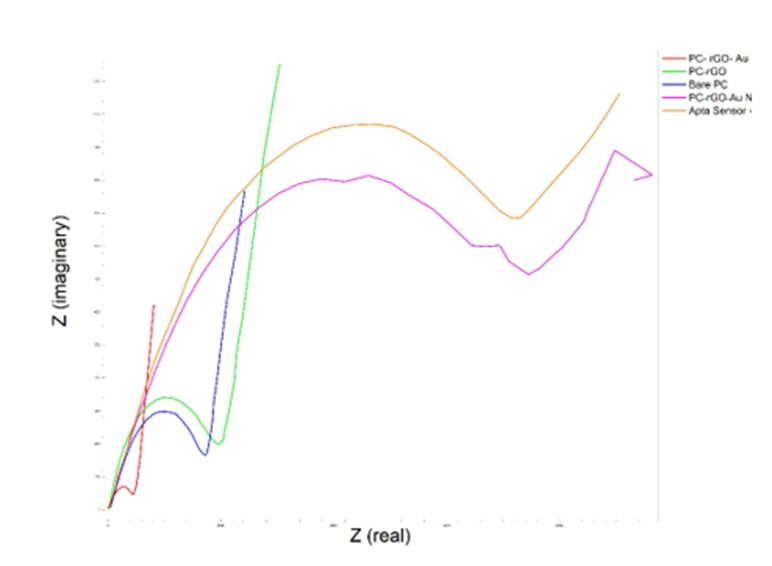
Fig. 4. Characterization of the synthesized materials using EIS
3.2.2. Investigation of Selectivity Level
To evaluate the performance and selectivity of the aptasensor towards hemoglobin, the experiment was conducted using three real urine samples containing hemoglobin, glucose, and fungus, respectively. SWV method was used for this purpose. According to the results in Fig. 5, the aptasensor's response to hemoglobin was faster, indicating the selectivity of the aptamer and, ultimately, the aptasensor. Given that real urine samples containing hemoglobin were used to determine the selectivity of the aptasensor, alternative interpretations of its results are possible. Urine samples containing hemoglobin were not interpretable to the naked eye, necessitating methods such as dipstick or microscopy to confirm the presence or absence of hemoglobin. Fortunately, all samples were obtained from pathology laboratories and were found to contain a trace amount of blood (1.0 mg/L).
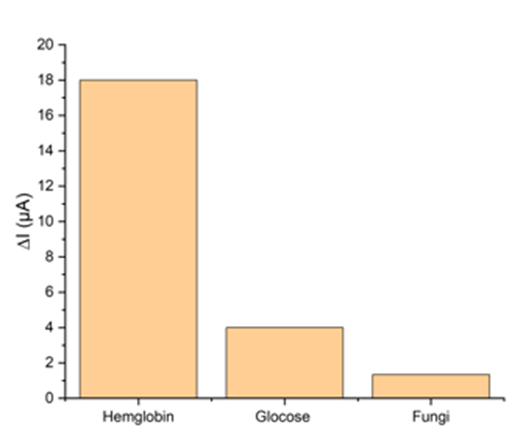
Fig. 5. Selectivity of the fabricated aptasensor (from left to right: hemoglobin, glucose, fungus)
3.2.3. Investigation of Concentration Effect
Cyclic voltammetry was used to determine the concentration effect on fabricated biosensor. As the analyte concentration increases, the electrochemical peak decreases because the resistance to electron transfer increases with increasing analyte concentration, and the maximum current decreases at each stage. Fig. 6 illustrates this phenomenon. Based on Fig. 6 data, it can be concluded that the detection limit of the aptasensor is 0.05 µg/mL.
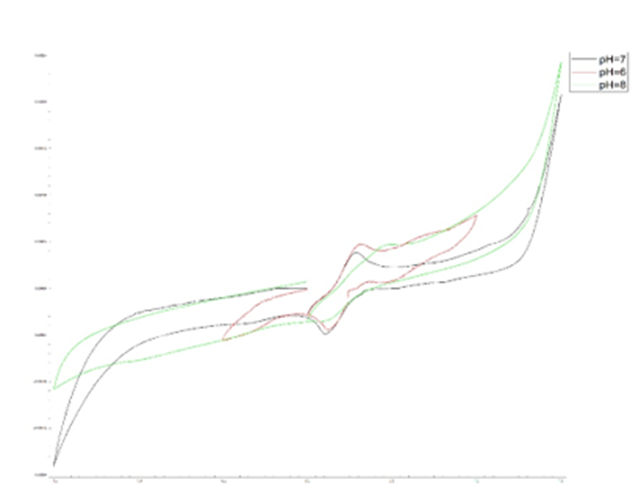
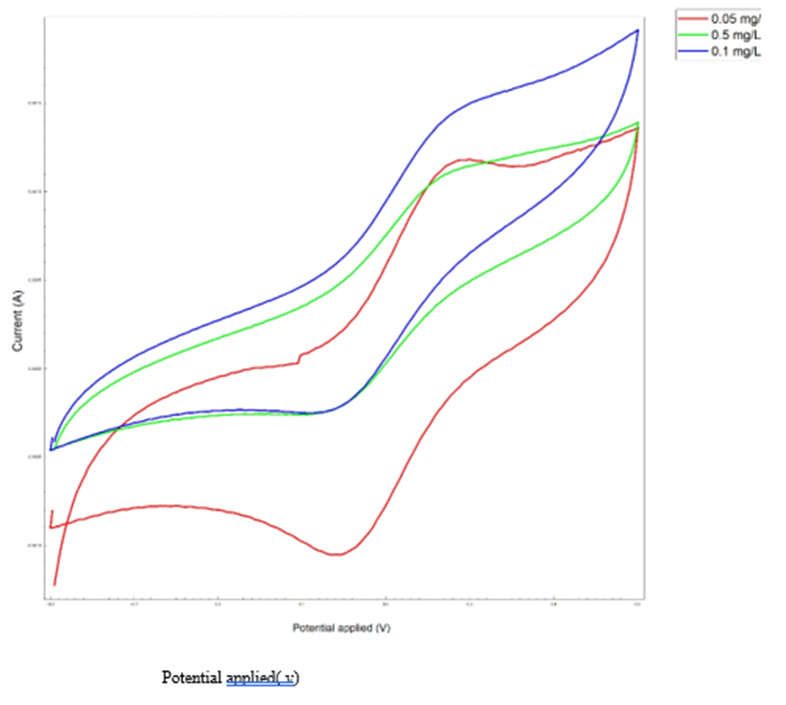
Fig. 6. Cyclic Voltametric Analysis. a) the effect of concentration (using real urine samples), b) the effect of pH
3.2.4. Aptasensor Response Time
To determine the optimal response time of the biosensor, a specific concentration of aptamer was used at different time intervals of 5, 15, 25, 35, and 45 minutes. Subsequently, CV was performed in the potential range of 0.2 to 0.5 V at a scan rate of 50 mV/s in a 2.0 mM ferrocyanide environment. According to the obtained results, at 5 minutes, the analyte's connection to the aptamer is negligible, indicating a very low absorption level. Additionally, the absorption level increased over time until 25 minutes, after which it remained relatively constant. These changes indicate that after 25 minutes, the analyte's absorption by the aptamer did not change significantly and is the optimal time. The fabricated aptasensor has a shelf life of one month and stable and reproducible until 6 successive uses without significant differences.
In the present research, a novel and advanced aptasensor was designed and fabricated for the detection of hematuria. Paper carbon, rGO, and AU-NPs were used to prepare this aptasensor. The developed aptasensor was also tested using actual urine samples, demonstrating its excellent selectivity and its ability to differentiate between normal and patient samples. Overall, this aptasensor was specifically designed to possess high sensitivity in medical facilities for the early detection of hematuria. The aptasensor exhibits the best performance at pH 7 and the detection limit of 0.05 µg/mL and a shelf life of 1 month has been achieved. The significant discoveries we made have the potential to drive progress in the critical area of hematuria detection.
Thanks to Amirkabir University of Technology for their support and encouragement to do this research work.
Dear Grace Pierce, Editorial Coordinator of Journal of Clinical Research and Reports, Thank you for the speedy and efficient peer review process. I appreciate the fact that your peer reviewers do not take months to respond like with some other journals. I would also like to thank the editorial office for responding quickly to my questions. It is an excellent journal. I plan to submit more manuscripts in the future. Best wishes from, Robert W. McGee

Dear Grace Pierce, Editorial Coordinator of Journal of Clinical Research and Reports, Working with you and your team on our recent publication in JCRR has been a truly wonderful and enjoyable experience. The responses were prompt, and the reviewers were patient, constructive, and highly professional. One reviewer in particular gave me the feeling that a professor was carefully reading and commenting on my coursework, which was deeply touching. The entire process was straightforward and hassle‑free, with no tedious online forms to complete. I highly recommend this journal. Best wishes from, DR Aibing Rao, Head of R&D

I Appreciate the Opportunity to Share my Experience with the Journal of Clinical Research and Reports. The peer review process was timely and constructive, and the feedback provided helped improve the quality of our manuscript. The editorial office was professional, responsive, and supportive throughout the process, ensuring smooth communication and efficient handling of the submission. Overall, it was a positive experience collaborating with your team.

Dear Mercy Grace, Editorial Coordinator of Obstetrics Gynecology and Reproductive Sciences, We would like to express our gratitude for your help at all stages of publishing and editing the article. The editors of the magazine answer all the necessary questions and help at every stage. We will definitely continue to cooperate and publish other works in the Obstetrics Gynecology and Reproductive Sciences! Best wishes from, Alla Konstantinovna Politova,

Dear Maria Emerson, Editorial Coordinator of International Journal of Clinical Case Reports and Reviews, What distinguishes International Journal of Clinical Case Report and Review is not only the scientific rigor of its publications, but the intellectual climate in which research is evaluated. The submission process is refreshingly free of unnecessary formal barriers and bureaucratic rituals that often complicate academic publishing without adding real value. The peer-review system is demanding yet constructive, guided by genuine scientific dialogue rather than hierarchical or authoritarian attitudes. Reviewers act as collaborators in improving the manuscript, not as gatekeepers imposing arbitrary standards. This journal offers a rare balance: high methodological standards combined with a respectful, transparent, and supportive editorial approach. In an era where publishing can feel more burdensome than research itself, this platform restores the original purpose of peer review — to refine ideas, not to obstruct them Prof. Perlat Kapisyzi, FCCP PULMONOLOGIST AND THORACIC IMAGING.

Dear Reader: We have published several articles in the Auctores Publishing, LLC, journal, Clinical Medical Reviews and Reports in recent years (CMRR). This is an ‘open access’ journal and the following are our observations. From the initial invitation to submit an article, to the final edits of galley proofs, we have found CMRR personnel to be professional, responsive, rapid and thorough. This entire process begins with Catherine Mitchell, Editorial Coordinator. She is simply outstanding, and, I believe, unparalleled in her capacity. I cannot imagine a more responsive and dedicated Editorial Coordinator. As I read the dates and timing of her correspondence with us, it seems that she never sleeps. I hope Auctores Publishing, LLC, appreciates her efforts as much as these authors do. Thank you to Auctores Publishing, LLC, to the Editorial Staff/Board, and to Catherine Mitchell from a grateful author(s).